
This is a tour for somebody who has just signed up. It follows the order Eido itself takes you through: finish the Get Started checklist, wait for the first sync, then look at a dashboard, find the devices that need attention, open one, run a report and set an alert. Allow half an hour, most of which is the sync.
If a colleague set Eido up and invited you, the checklist is already done. Skip to Look at your dashboard.
Before anything else: accept the terms#
The first time anybody from a new organisation signs in, a box titled Terms of Service & Data Processing Agreement covers the page. Nothing else can be used until it is accepted.
- An administrator switches on the confirmation that they are authorised to accept on the organisation’s behalf, then clicks Accept and Continue. This happens once for the whole organisation.
- Anybody else sees a message asking them to contact their administrator, and a Log Out button.
Finish the Get Started checklist#
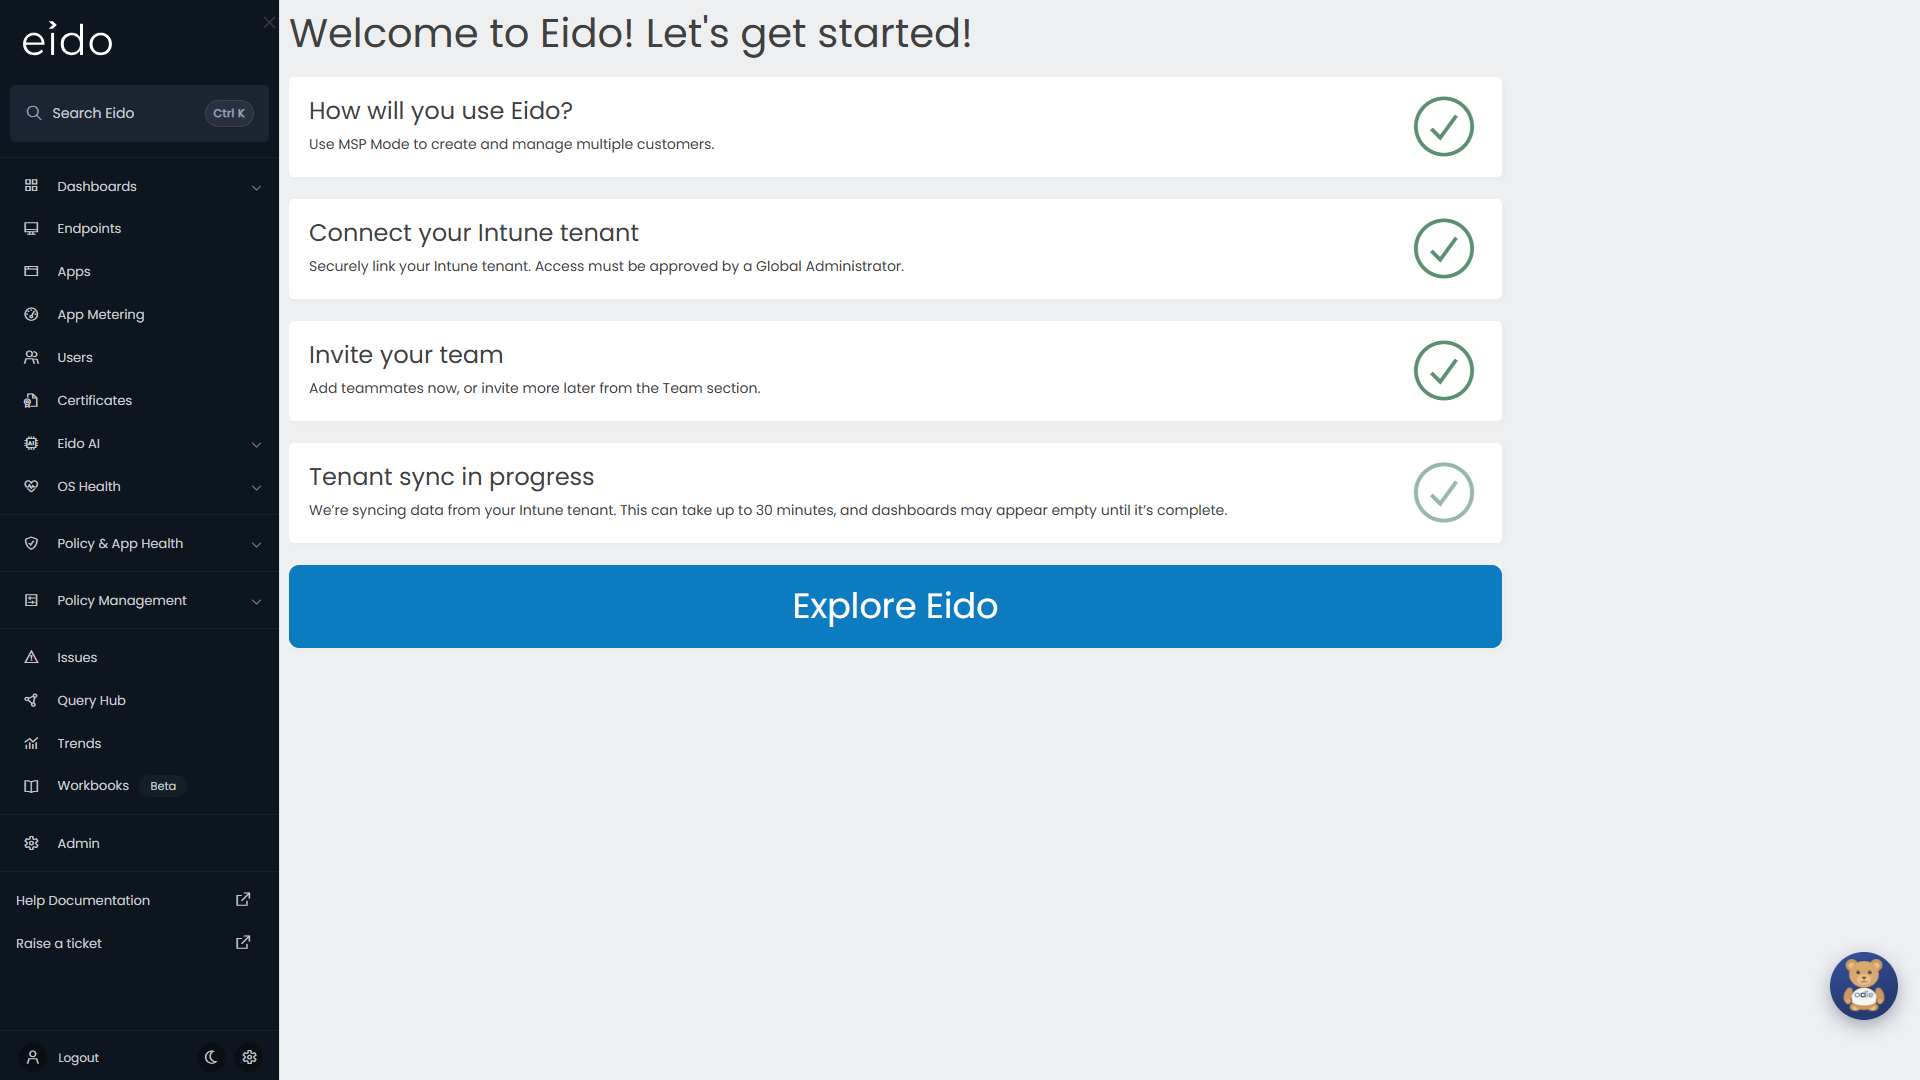
Until set-up is finished, Eido opens on Get Started and brings you back to it from any other page. The page is headed “Welcome to Eido! Let’s get started!” and has four boxes. A green tick appears on each box as it is completed.
-
How will you use Eido?
Choose Internal IT Team if you look after one organisation, your own. Choose MSP if you look after several. MSP adds customers to Eido: a customer filter in the sidebar, a Customers overview and a Customer column in the lists. See Customers overview.
Choose carefully. There is no setting in Eido to change this afterwards, so contact support if you need it changed.
-
Connect your Intune tenant
Click Grant Access and choose an access level. Read-Only Access is enough for everything in this tour. Read-Write Access is needed only for Policy Management. You are then sent to Microsoft to approve the access, which has to be done by a Global Administrator of the tenant. Connecting Intune walks through it, and Permissions Eido needs lists what is being approved.
To look around before connecting anything real, click Grant Access and choose Create Demo Data instead of an access level. It adds a demo tenant with sample devices, policies, apps and usage data.
Skip moves on without connecting a tenant. You can connect one later under Intune tenants.
-
Invite your team
Type a name and an email address for up to three colleagues and click Invite. Each one is sent a welcome email. A row with only a name or only an email address is flagged, and Invite stays unavailable until every row you have started is complete and the email addresses are valid.
Skip moves on. You can invite people at any time under Team, where you can also choose each person’s role.
-
Tenant sync in progress
Nothing to do here. Eido is copying your tenant’s data, which can take up to 30 minutes. Dashboards and lists may be empty until it finishes.
When the first three steps are done, an Explore Eido button appears at the bottom of the page. Click it to go to your dashboard. Once set-up is finished, Get Started is no longer listed in the sidebar.
Look at your dashboard#
Eido opens on your default dashboard. It is the one with a star next to it when you expand Dashboards in the sidebar.
Everybody starts with a dashboard of their own called Default Dashboard. It is yours to change, and nobody else sees your changes. Out of the box it has:
- a row of tiles counting your devices, how many are compliant, inactive or lost, and your compliance, configuration and application issues (split into High and Medium)
- a list of the top issues across the estate
- compliance by department
- pie charts of devices by operating system, by OS support and by warranty status
A dashboard is a page of tiles and charts. Many of them can be clicked to open the list behind the number, already filtered.
Things to try on day one:
- Click a tile or a slice of a chart and see where it takes you.
- Click the full-screen button at the top right to hide the sidebar and fill the window.
- Click Edit to rearrange a dashboard you own, or New Dashboard to start another. In edit mode, Add Item adds a tile or chart, and Save keeps your changes.
If the dashboard is empty, the first sync has probably not finished. Give it half an hour from the moment you connected the tenant.
See Dashboards and Building a dashboard.
Find the devices that need attention#
Click Endpoints in the sidebar. Every device in your tenant is listed, with the worst at the top.
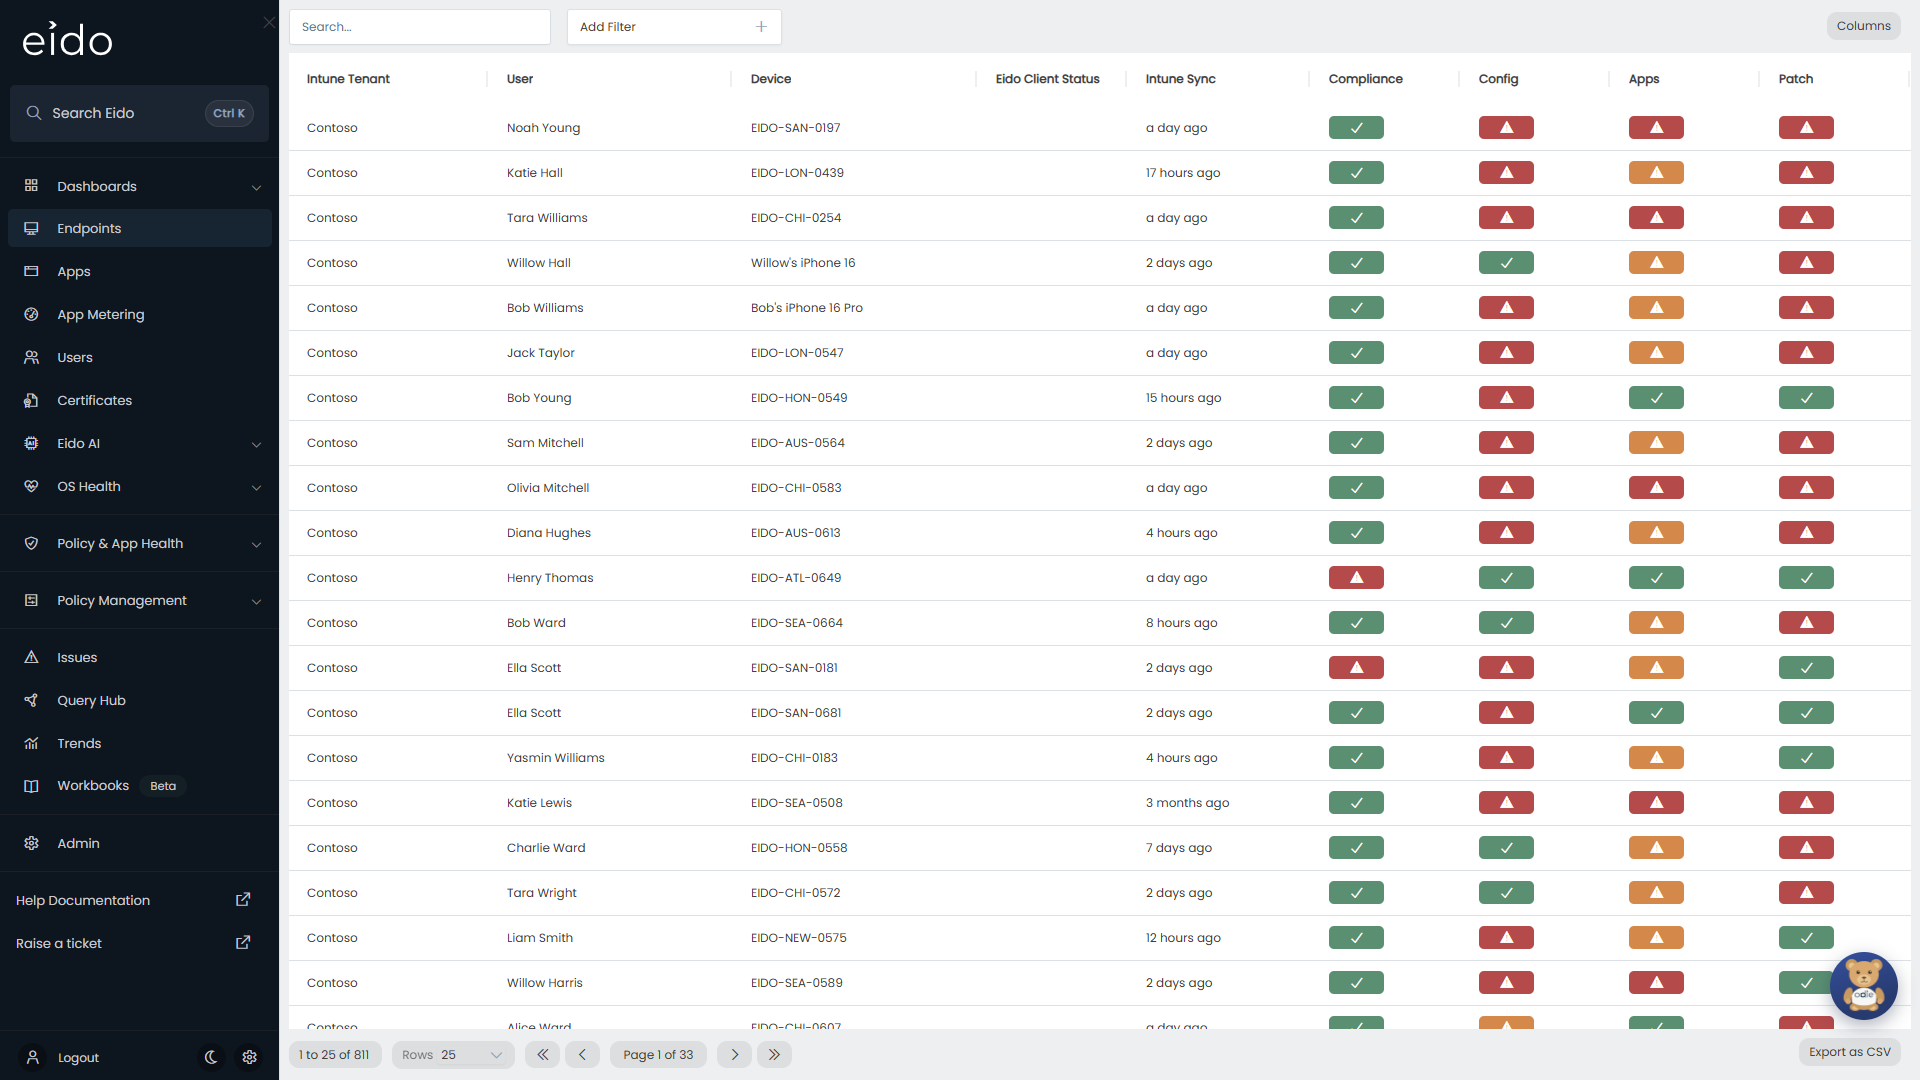
Each row has four statuses: Compliance, Config, Apps and Patch. Green is healthy, amber is Unhealthy - Medium, red is Unhealthy - High and grey is Unknown. Key concepts explains how each is worked out.
To narrow the list down:
- Type part of a device name in Search….
- Click Add Filter and choose what to filter by. Device Status set to Unhealthy - High gives you the red devices only. OS Patch Status, Compliance Status, Config Status and App Status do the same for one category.
- Click a column heading to sort by it.
- Click Columns to choose which columns are shown.
A good first question is “which devices are red for patching?”. Add the OS Patch Status filter, choose Unhealthy - High, and you have your list. Export as CSV at the foot of the table downloads it.
Endpoints covers the list in full. Issues shows the same problems the other way round: one row per problem, not one row per device.
Open a device#
Click any row. The device opens in a panel that slides in from the right, over the list, so closing it puts you back where you were.
The panel has a menu down its left side. A coloured dot beside Patches, Compliance, Config Policies and Managed Apps repeats the status from the list, so you can see at once which one to open. Start with these:
| Section | What it tells you |
|---|---|
| Overview | A summary of the device |
| Patches | Where the device stands on updates and operating system support |
| Compliance | Each compliance policy assigned to the device, and its result |
| Config Policies | Each configuration profile, and whether it applied |
| Managed Apps | Each app you deploy to the device, and whether it installed |
| Device Issues | The device’s open and resolved issues |
Whichever category was red in the list, open the matching section to see the exact policy, app or update behind it. Device details describes every section.
Run a built-in report#
Click Query Hub in the sidebar. The page is headed All Reports, and each card is a report.
-
Pick a category
Out of the Box on the left holds the reports that come with Eido, grouped by subject. Click a category, or type in Search reports….
-
Run it
Click Run on a card. The report opens with its filters, columns and chart already set.
-
Make it yours
Change a filter, add a column or change the grouping, then save the result as a report of your own. It appears under My Reports.
Build Custom Report starts from an empty query. See Query Hub, Building a query and Saving and exporting reports. If Odie is switched on, you can also ask him for a report, a chart or a whole dashboard in plain English, and Things to ask Odie has examples to copy.
Set an alert#
An alert tells you when a device or certificate becomes unhealthy, so that you do not have to keep checking. You need to be an administrator.
-
Open Alerts
Click Admin in the sidebar, then the Alerts tile, then Create Alert.
-
Name it and choose what it watches
Fill in Friendly Name. Under Alert Type, choose Device Issues or Certificate Issues.
-
Choose where it goes
Under Destination, choose Email, Slack, Teams, Webhook or ServiceNow, and fill in the details that appear.
-
Choose what triggers it
Under Alert On, set the Severity to Unhealthy - Medium or Unhealthy - High, and switch on the kinds of issue you want to hear about, such as Compliance Issues, Config Policy Issues, Managed App Issues or Patch Overdue Issues.
-
Click Save
The alert joins the list on the Alerts page, where you can open it again to change it.
A sensible first alert is Unhealthy - High device issues sent to the team’s shared mailbox or channel. Alerts covers every option.
What to do next#
- Tenant settings Decide which failures count as Medium, High or not at all.
- Patch compliance See how far behind your Windows devices are.
- Roles Control what each team member can see.
- Setting up App Metering Find out which applications are really used.
Questions people ask#
Why is everything empty?#
The first sync can take up to 30 minutes. If it has been longer, check that the tenant was connected and not skipped: an administrator can see it under Intune tenants. If it is there and still empty, see Troubleshooting.
Why does Eido keep sending me back to Get Started?#
A step is still waiting. Finish it, or click Skip where it is offered, and Eido lets you move on.
The box for the last step never changes. Is the sync stuck?#
No. Tenant sync in progress is a reminder, not a progress bar. Its tick appears as soon as the earlier steps are done, whether or not the sync has finished.
I chose Internal IT Team and now need customers. What do I do?#
Contact support. The choice cannot be changed from inside Eido.
A colleague I invited did not get the email.#
Open their row under Team. For somebody who has never signed in, Resend welcome email sends it again.