
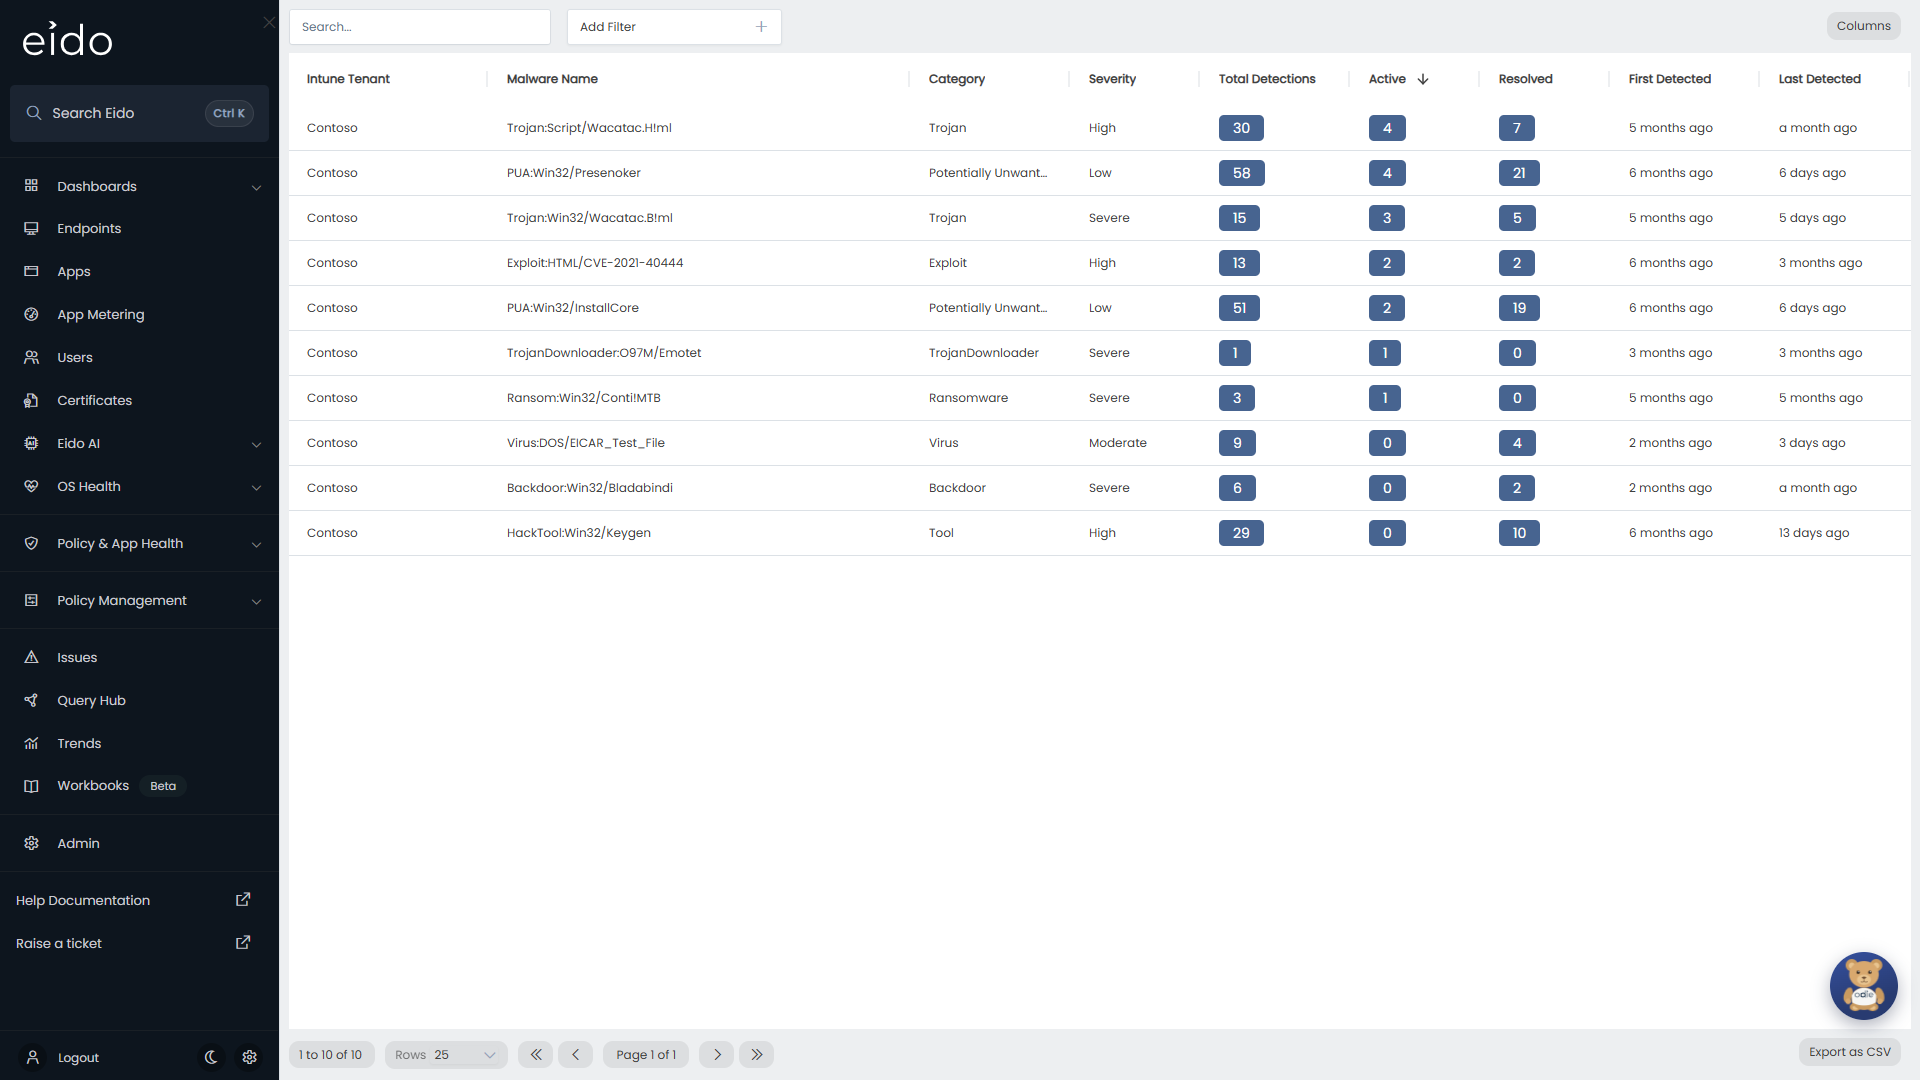
Active Malware lists the malware that Intune’s active malware report shows on your devices, grouped by the name of the threat. For each one it shows how many devices still have it and how many have been cleared. Despite the name, the screen is also a history: when a detection is dealt with, Eido keeps it and marks it resolved, so you can see what has been through your estate and which devices are repeat offenders.
It is the last item under Policy & App Health in the sidebar. Everyone who signs in can open it. An administrator can block or filter the data behind it for a role.
What the list shows#
There is one row for each threat in each Intune tenant. The list opens sorted by Active, highest first.
| Column | What it means |
|---|---|
| Customer | The customer the tenant belongs to. Only shown when you look after several customers and have not picked one. |
| Intune Tenant | The tenant the detections came from. |
| Malware Name | The threat’s name, as Intune reports it. |
| Category | The kind of threat, for example a trojan or potentially unwanted software, as Intune reports it. |
| Severity | The severity Intune reports for the threat. |
| Total Detections | How many times the threat has been detected, added up across every device. One device can account for several. |
| Active | Devices where the detection is still active. |
| Resolved | Devices where it has been resolved. |
| First Detected | The earliest time the threat was first detected on any of your devices. |
| Last Detected | The most recent time it was first detected on a device, which is when it last reached a new one. |
The counts are plain numbers and Severity is plain text. Nothing on this screen is colour coded.
Active and resolved#
A detection is Active for as long as Intune keeps it in its active malware report for that device.
When it drops out of that report, Eido marks it Resolved and records when. It is never deleted, so the row stays in the list with its Resolved count. If the same threat turns up again on the same device, the detection goes back to Active.
A threat with Active at zero is one you have had and no longer have.
Find a threat#
- Search… matches any part of the malware name.
- Add Filter narrows the list by Customer, Intune Tenant, Malware Name, Category or Severity.
- Press a column heading to sort, for example by Last Detected to see what is newest.
- Columns opens Select Columns to show, hide and reorder columns. Reset to Defaults puts them back. Your layout is remembered.
- Export as CSV downloads every matching row with the columns you have showing.
See the devices behind a threat#
Press a threat to open the devices it was found on, in a panel on the right. Active detections come first.
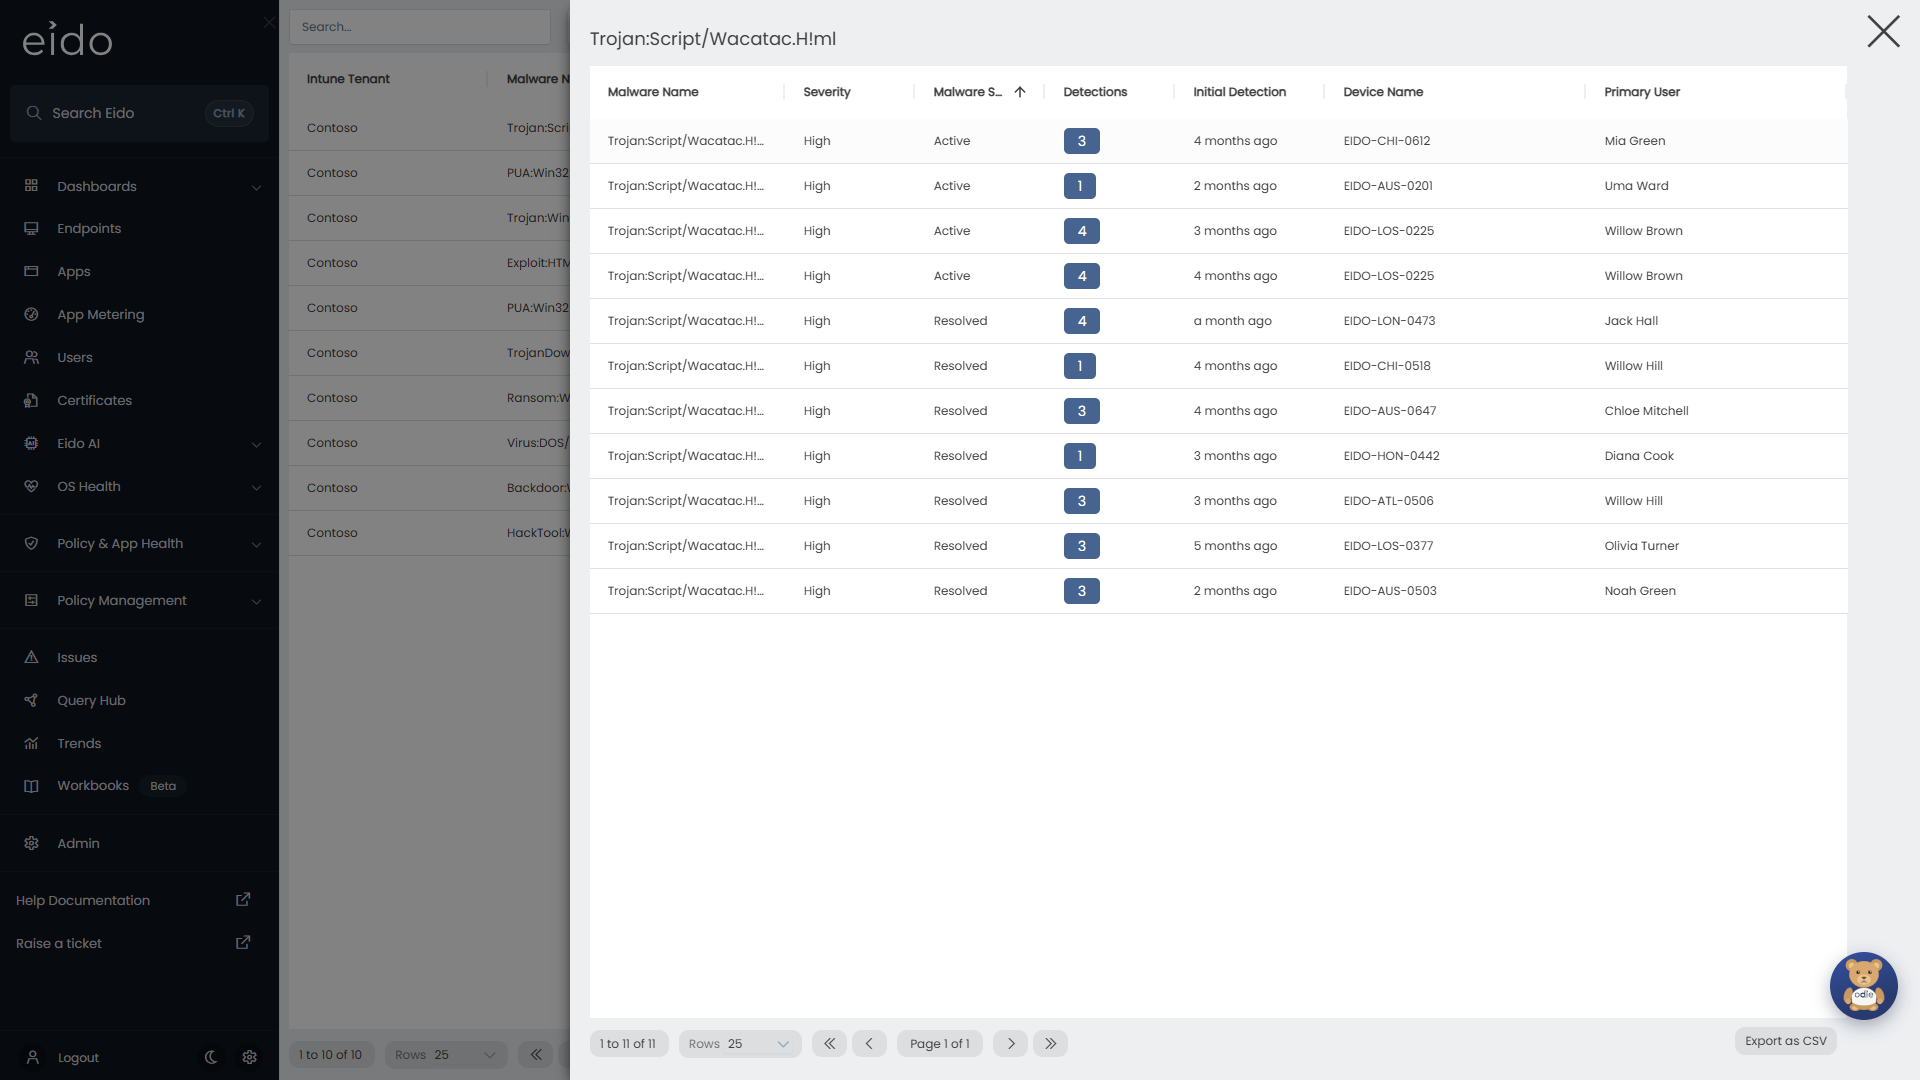
| Column | What it means |
|---|---|
| Malware Name | The threat you opened. |
| Device | The device’s name. |
| Primary User | The device’s primary user. |
| Severity | The severity Intune reports for this detection. |
| Malware Status | Active or Resolved, by the rule above. |
| Detections | How many times the threat was detected on this device. |
| Initial Detection | When it was first detected on this device. |
Sort by Detections to find the devices that keep being reinfected. Export as CSV takes the whole list. Press a row to open the device in Device details.
Going further in Query Hub#
The Active Malware Detail view in Query Hub holds one row for each device and threat, across every threat at once. It is the place to ask questions this screen cannot, such as “which devices have the most active detections of any kind?”.
As well as the columns above, it has:
| Column | What it means |
|---|---|
| Execution State | Whether the malware was running, blocked and so on, as Intune reports it. |
| Malware State | What happened to it, for example detected, cleaned or quarantined, as Intune reports it. |
| Reported UPN and Reported User | The user Intune recorded against the detection. |
| Managed By | What manages the device, as Intune reports it. |
| First Seen | When Eido first saw the detection. |
| Resolved At | When Eido marked it resolved. |
| Last Synced | When Eido last read it from Intune. |
Every device column is available too, so you can group detections by model, operating system, department or anything else Eido knows about the device. See Filters, grouping and charts.
The Active Malware view is this screen’s list, and Active Malware Summary is a ready-made report under Policy Health.
For one device, Device details has an Active Malware section with that device’s detections.
An administrator can also build an automation over Active Malware Detail, for example to be told when a new detection appears.
Why does it show that?#
Defender has cleaned it, and it still shows as Active#
Eido follows Intune’s report. A detection stays Active until Intune stops listing it for that device. It then becomes Resolved at Eido’s next sync.
Resolved is not the same as cleaned#
Resolved means Intune no longer reports the detection as active. To see what actually happened to the malware, look at Malware State in the Active Malware Detail view.
Total Detections is higher than Active plus Resolved#
Active and Resolved count devices. Total Detections counts detections, and one device can report several for the same threat.
The same threat appears on two rows#
It was reported under two categories, or in two Intune tenants. Each combination has its own row.
The list is empty#
Intune has reported no malware for the tenants you can see. That is the result you want.
How fresh is this?#
Eido reads the report from Intune every time it syncs the tenant, about once an hour. See What Eido syncs.