
Anybody who can sign in to Eido can build dashboards. A dashboard belongs to the person who created it: only its owner can edit it, share it, make it their default or delete it. Everybody else who can see it sees it read only.
For what the finished widgets show and how to read them, see Dashboards.
Create a dashboard#
-
Start a new dashboard
In the sidebar, open Dashboards, press Create New and choose New dashboard. The New Dashboard button at the top of any dashboard does the same.
-
Name it
The dashboard opens in edit mode, called New Dashboard, with the standard set of widgets already placed. Type a name in the box at the top left.
-
Arrange the widgets
Add, remove, move and resize widgets as described below. Clear empties the whole grid if you would rather start from nothing.
-
Save
Press Save. The dashboard appears in the Dashboards list in the sidebar and opens for viewing.
Nothing is kept until you press Save. Cancel on a new dashboard throws it away and returns you to your default dashboard.
Edit a dashboard#
Open a dashboard you own and press Edit. The grid lines appear and the top of the page changes to the editing controls.
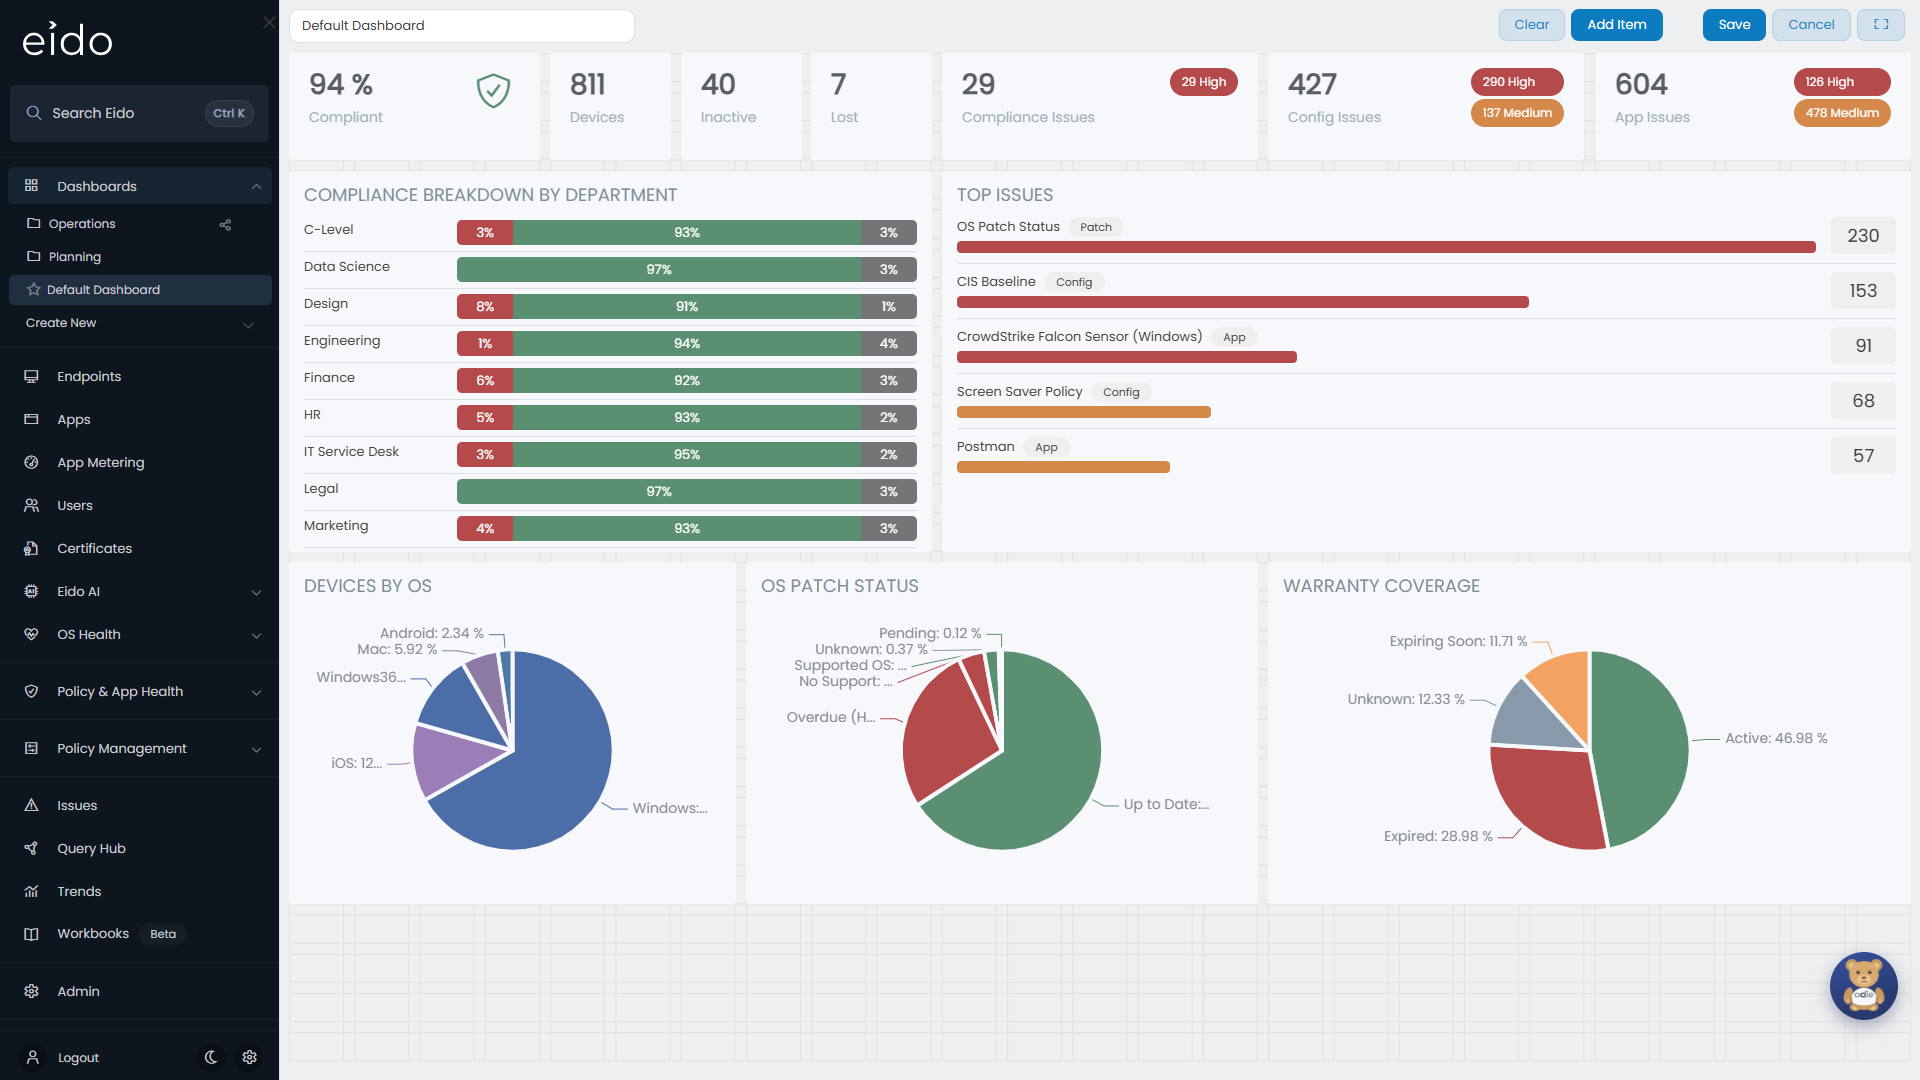
| Control | What it does |
|---|---|
| The name box | Renames the dashboard. |
| Share Dashboard | Lets other people see the dashboard. See Share a dashboard. |
| Make Default | Makes this your default dashboard. Not shown on the dashboard that is already your default, or on one you have not saved yet. |
| Delete | Deletes the dashboard. Hidden in the same two cases. |
| Clear | Removes every widget from the grid. |
| Add Item | Opens the widget chooser. |
| Save | Keeps your changes and leaves edit mode. |
| Cancel | Discards everything since you pressed Edit. |
While you are editing, the built-in widgets do not act as links, so you can drag one without being taken to another page.
Move, resize and remove widgets#
- Move a widget by dragging it. Dropping it onto another widget swaps the two.
- Resize a widget by dragging its edge or corner. Every widget has a smallest size it will not go below.
- The icons at the top of each widget are Duplicate widget, Edit widget and Delete widget. Edit widget is only on widgets built from a query: custom widgets and ones added from an existing report. Deleting asks you to confirm.
- A duplicate of a query widget is a separate copy, with “(Copy)” added to its title. Changing one does not change the other.
The grid is 25 columns wide and grows downwards as far as you need. In a browser window narrower than 1,000 pixels the widgets stack in a single column instead.
Add a widget#
Press Add Item. The Add Widget window offers three ways to add one.
| Choice | Use it for |
|---|---|
| Gallery | One of Eido’s ready-made widgets. |
| Custom | A widget you build from any data in Query Hub. |
| Existing report | A copy of a Query Hub report you can already see. |
A new widget is placed in the first free space that fits it. Drag it to where you want it.
From the gallery#
The Widget Gallery groups the ready-made widgets. Select one and press Add Widget.
| Group | Widgets |
|---|---|
| Metrics | Compliance %, Device Count, Inactive Device Count, Lost Device Count, Compliance Issue Count, Configuration Issue Count, Application Issue Count |
| Top Lists | Top 5 Issues, Top 5 Compliance Issues, Top 5 Configuration Issues, Top 5 Application Issues |
| Tables | New Devices, Inactive Devices, Longest Non-Compliant Devices, Devices with the most issues |
| Charts | Devices by OS, Devices by manufacturer, Devices by model, Devices by encryption, Devices by owner type, OS Patch Status, Devices by warranty status, and Chart of issues by Department, Office, Country and State |
| Breakdowns | Compliance % By Department, By Office, By Country and By State |
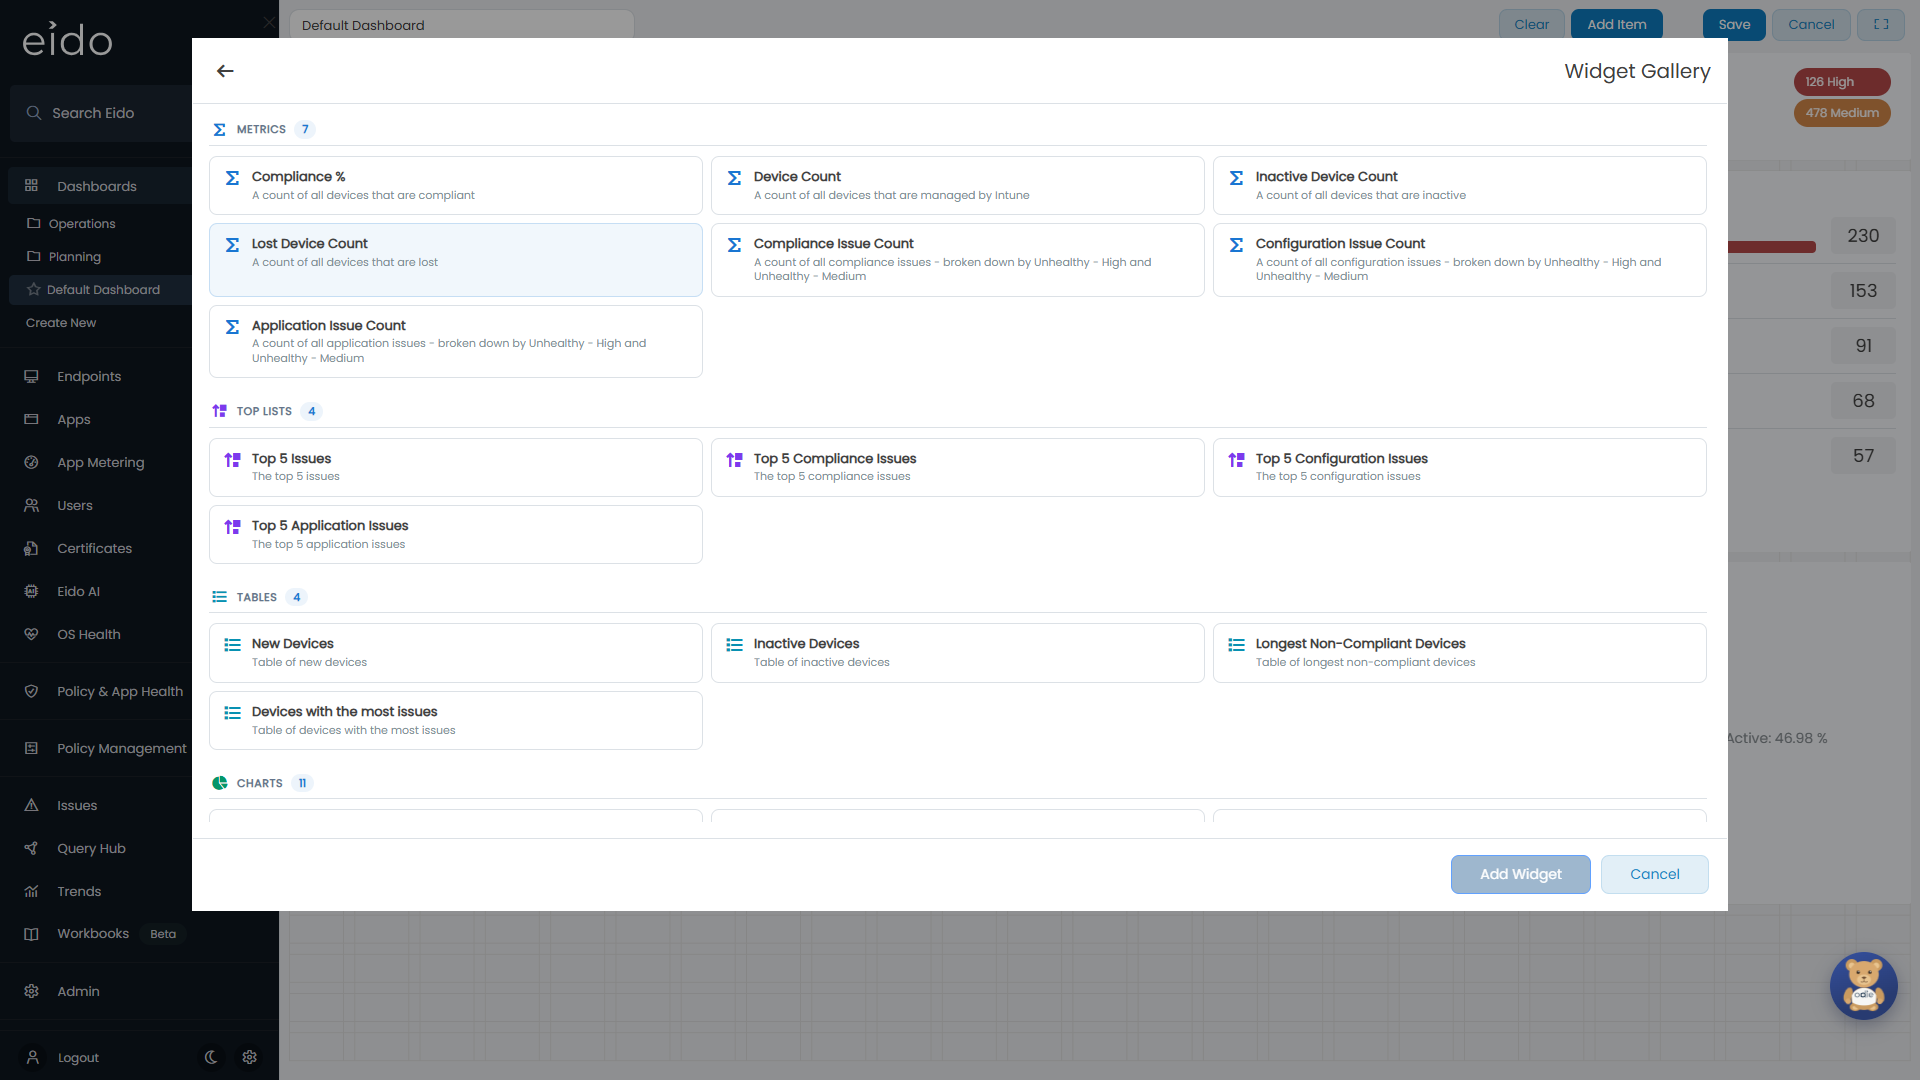
The gallery lists only the widgets your role has the data for. If your role cannot see issues, for example, the issue widgets are not offered. What each widget counts is in Dashboards.
Build a custom widget#
Custom opens Create Custom Widget, which is the Query Hub query builder in a window.
-
Give it a title
Type it in the Widget title box at the top. The title is shown above the widget, or as the caption of a tile.
-
Choose a view
View is the data the widget reads: devices, issues, apps and so on.
-
Choose how it is drawn
Under Visualization, pick Table, Bar Chart, Pie Chart or Tile.
-
Filter and shape it
Add Filters, and for a chart choose a Group By column.
-
Preview
Press Preview to see the result with your real data.
-
Add it
Press Add to Dashboard.
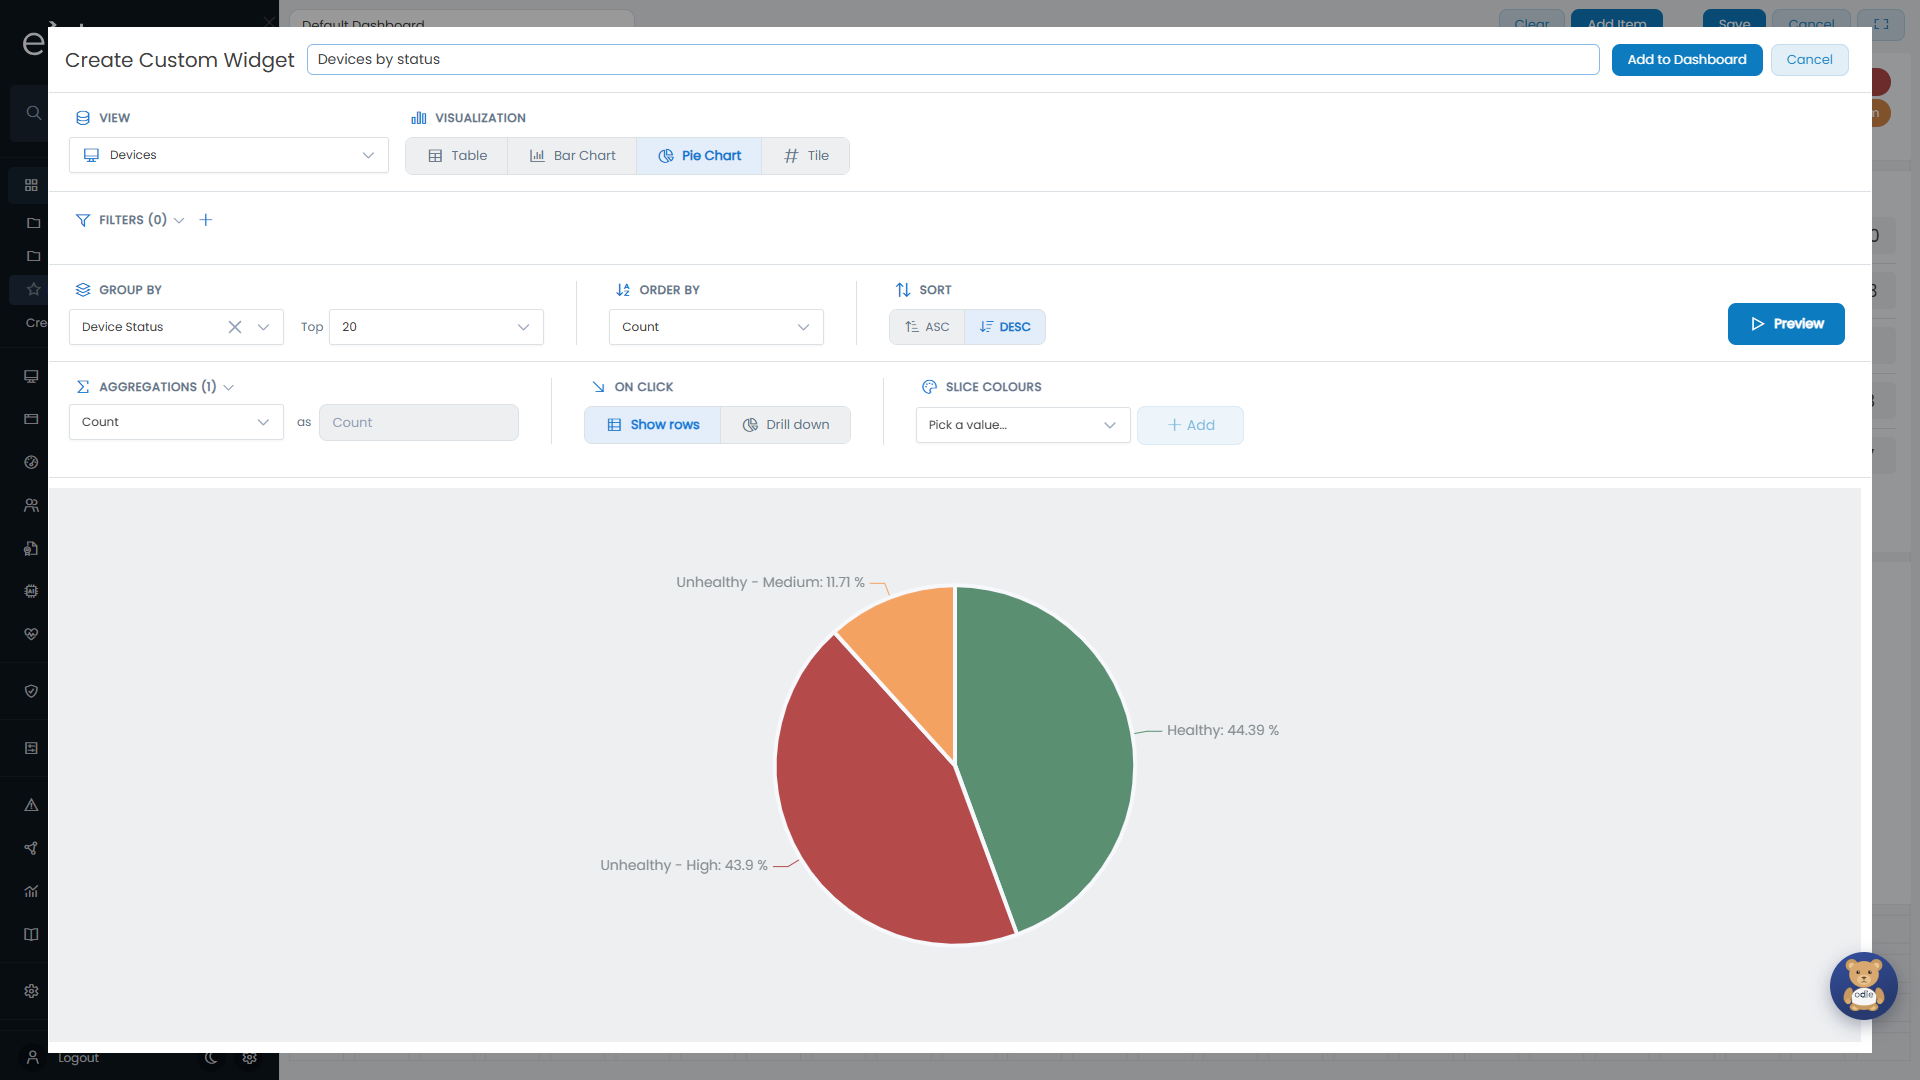
To change a custom widget later, put the dashboard in edit mode and press the pen icon on the widget. The same window opens as Edit Custom Widget, with Save Changes in place of Add to Dashboard.
From an existing report#
Existing report opens a list of the reports you can see in Query Hub, under Built-in, Shared with you and Mine, with a search box. Each row shows whether the report is a table, a bar chart, a pie chart or a metric. Select one and press Add widget.
The report is added as a copy. Editing the widget does not change the original report, and later changes to the original do not reach the widget.
Chart types and options#
These are the choices in the custom widget window. The query builder itself is covered in Building a query and Filters, grouping and charts.
| Visualization | Shows | Needs |
|---|---|---|
| Table | Rows and the columns you choose, or one row per group if you set Group By. | Nothing more. |
| Bar Chart | One bar per group. | A Group By column. |
| Pie Chart | One slice per group. | A Group By column. |
| Tile | A single number. | Nothing more. |
Until a Group By column is chosen, the two chart buttons are greyed out and marked “(Requires Group By)”.
| Option | Applies to | What it does |
|---|---|---|
| Filters | All | Limits the rows the widget counts. |
| Group By | Table, bar, pie | The column to group on. For a date column, a second box chooses the interval: Hour, Day of Week, Date, Date & Hour, Month, Quarter, Year, or Distinct for each separate value. |
| Top | Grouped widgets | How many groups to keep: 5, 10, 20, 50, 100 or All. It starts at 20. |
| Order By and Sort | Table, bar, pie | The column to sort on, and ASC or DESC. |
| Aggregations | Grouped widgets | What is worked out for each group: Count, Sum, Min, Max, Avg or Distinct Count, with a name of your own. A grouped table can have several. |
| On click | Grouped widgets | Show rows opens the rows behind the bar or slice that was pressed. Drill down regroups them by the next column you list under Drill into. |
| Slice colours | Bar, pie | Fixes the colour of a named bar or slice. |
| Aggregation | Tile | The number on the tile: a count, or a sum, minimum, maximum, average or distinct count of a column. |
| Tile colour | Tile | A Base colour, and Rules that change the colour when the value is above, below or equal to a number. The first rule that matches wins. |
| Columns | Table, not grouped | Which columns to show, with Show All, Hide All and a search box. |
Share a dashboard#
In edit mode, switch on Share Dashboard and press Save.
- A shared dashboard appears in the Dashboards list of the other people in your organisation. If you manage several customers, it is shared within the customer selection it was created in.
- They can open it and click through from it. They cannot edit it, and see Shared with you where the Edit button would be.
- Custom widgets on the dashboard are shared along with it.
- Each viewer sees the figures for the devices their own role allows, which may be fewer than you see.
- Anybody who does not want it in their list can hide it, see Dashboard folders.
Switch Share Dashboard off and save to make the dashboard private again.
Set your default dashboard#
Your default dashboard is the one that opens when you sign in, and the one marked with a star in the sidebar.
Open the dashboard you want, press Edit, then Make Default. It takes effect at once, without pressing Save. Press Cancel to leave edit mode.
Only a dashboard you own can be your default. If you manage several customers, you have one default for each selection in the customer picker.
Delete a dashboard#
Open the dashboard, press Edit, then Delete, and confirm. This cannot be undone.
Your default dashboard has no Delete button. Make another dashboard the default first, then delete the old one.
Common questions#
Why is there no Edit button?#
You do not own the dashboard. Create your own with New Dashboard and add the widgets you want.
Why are Make Default and Delete missing?#
Either the dashboard is already your default, or it is new and has not been saved yet.
Why are Bar Chart and Pie Chart greyed out?#
A chart needs something to split by. Choose a Group By column and the buttons become available.
Why does the widget window say “Click Preview to see results”?#
The builder does not run the query until you ask. Press Preview after changing the view, filters or grouping.
Why did saving fail with “Select a view before saving” or “Enter a widget title”?#
A custom widget needs both. Choose a View and fill in the Widget title box.
I deleted a widget by mistake. Can I get it back?#
Yes, if you have not saved. Press Cancel and the dashboard returns to how it was when you pressed Edit.