
Remediations and Scripts are two lists under Policy & App Health in the sidebar. The first covers Intune remediations (script packages that detect a problem and then fix it). The second covers the Windows PowerShell scripts you run from Intune. Each list has one row per remediation or script, with a count of devices in each outcome, and each row opens the devices behind the counts.
Everyone who signs in can open both. An administrator can block or filter the data behind them for a role.
Remediations#
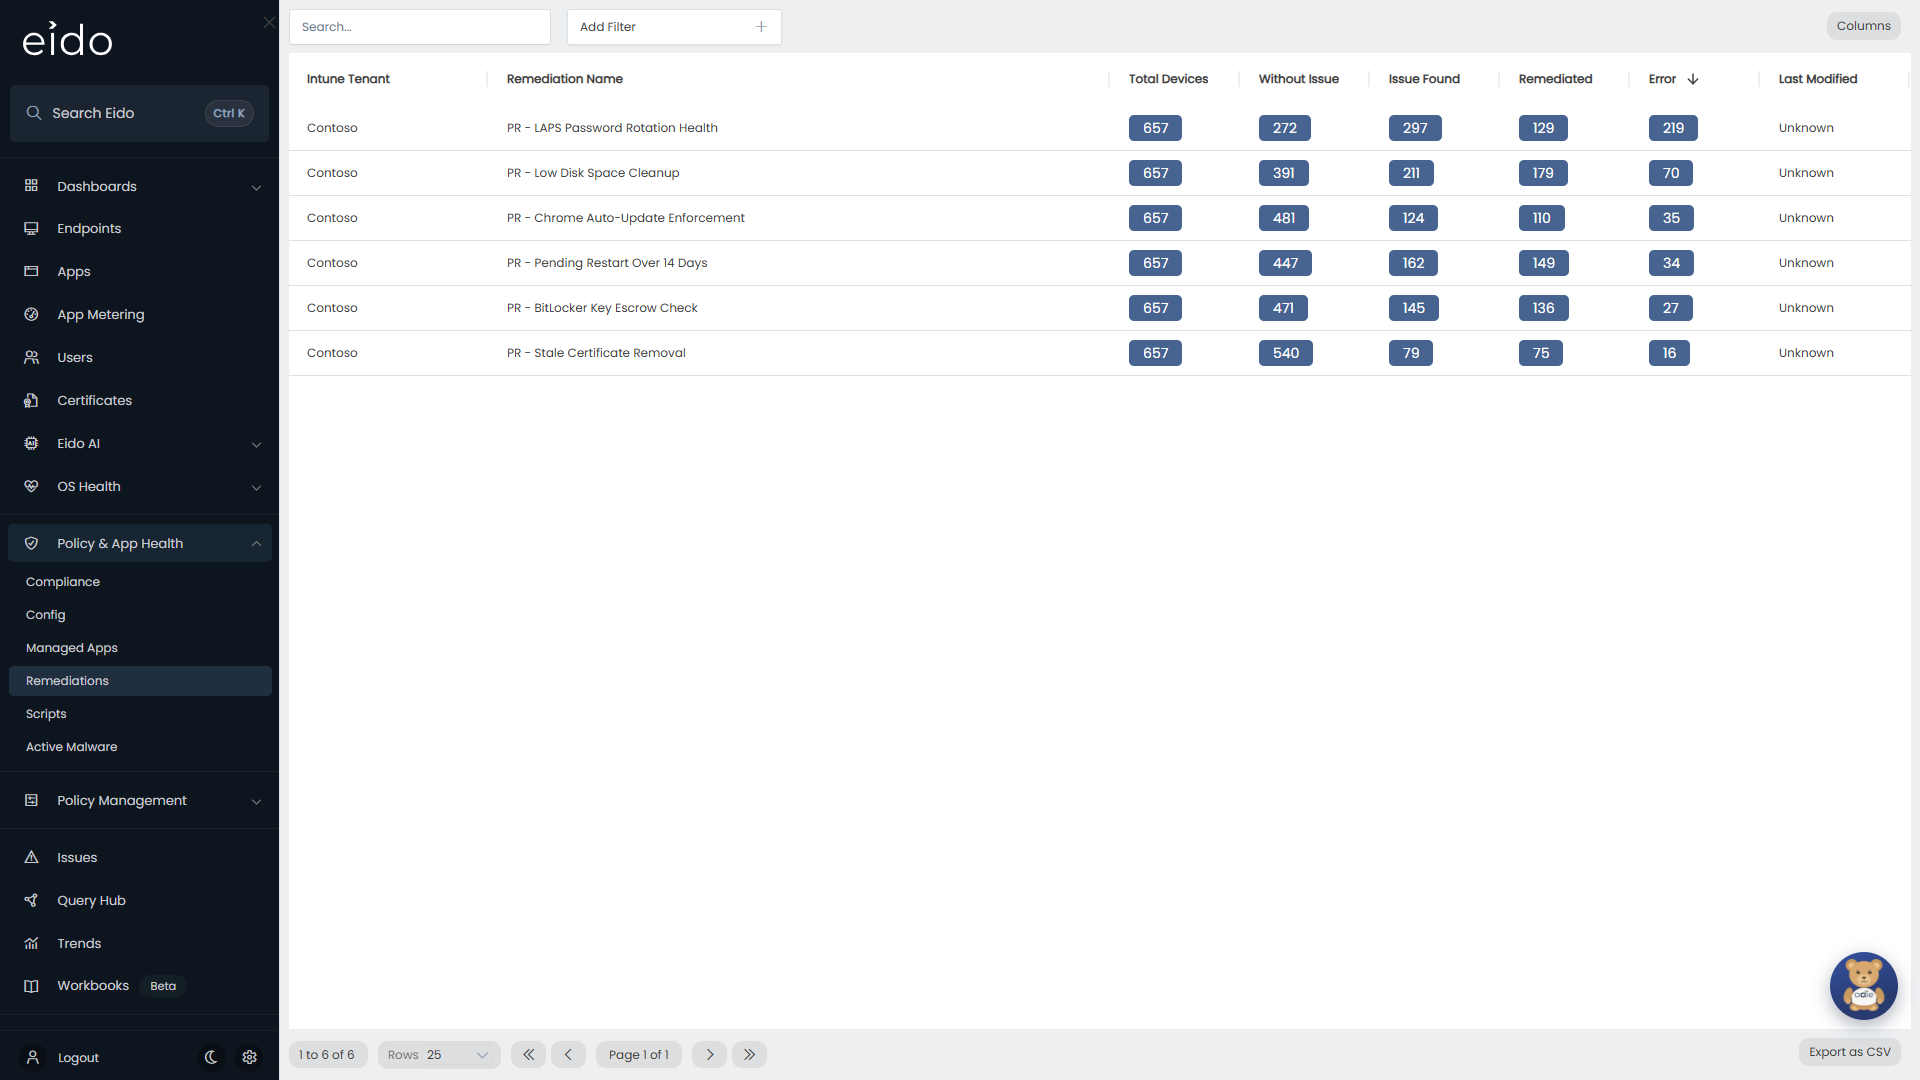
There is one row for each remediation in each Intune tenant. The list opens sorted by Error, highest first.
| Column | What it counts |
|---|---|
| Customer | The customer the tenant belongs to. Only shown when you look after several customers and have not picked one. |
| Intune Tenant | The tenant the remediation lives in. |
| Remediation Name | The remediation’s name in Intune. |
| Total Devices | Devices that have reported a run of this remediation. |
| Without Issue | Devices where detection ran and found nothing wrong. |
| Issue Found | Devices where detection found the problem. |
| Remediated | Devices where the fix ran and the problem is gone. |
| Error | Devices where detection failed, or where the fix failed or timed out. |
The counts are plain numbers. Nothing on this screen is colour coded.
A device can be counted in more than one column. A device where the problem was found and then fixed is in both Issue Found and Remediated. A device where the problem was found and the fix failed is in both Issue Found and Error. That is why the columns do not add up to Total Devices.
The pattern to look for is a high Issue Found with a low Remediated: the remediation is finding the problem and not fixing it.
The devices behind a remediation#
Press a remediation to open its devices in a panel on the right.
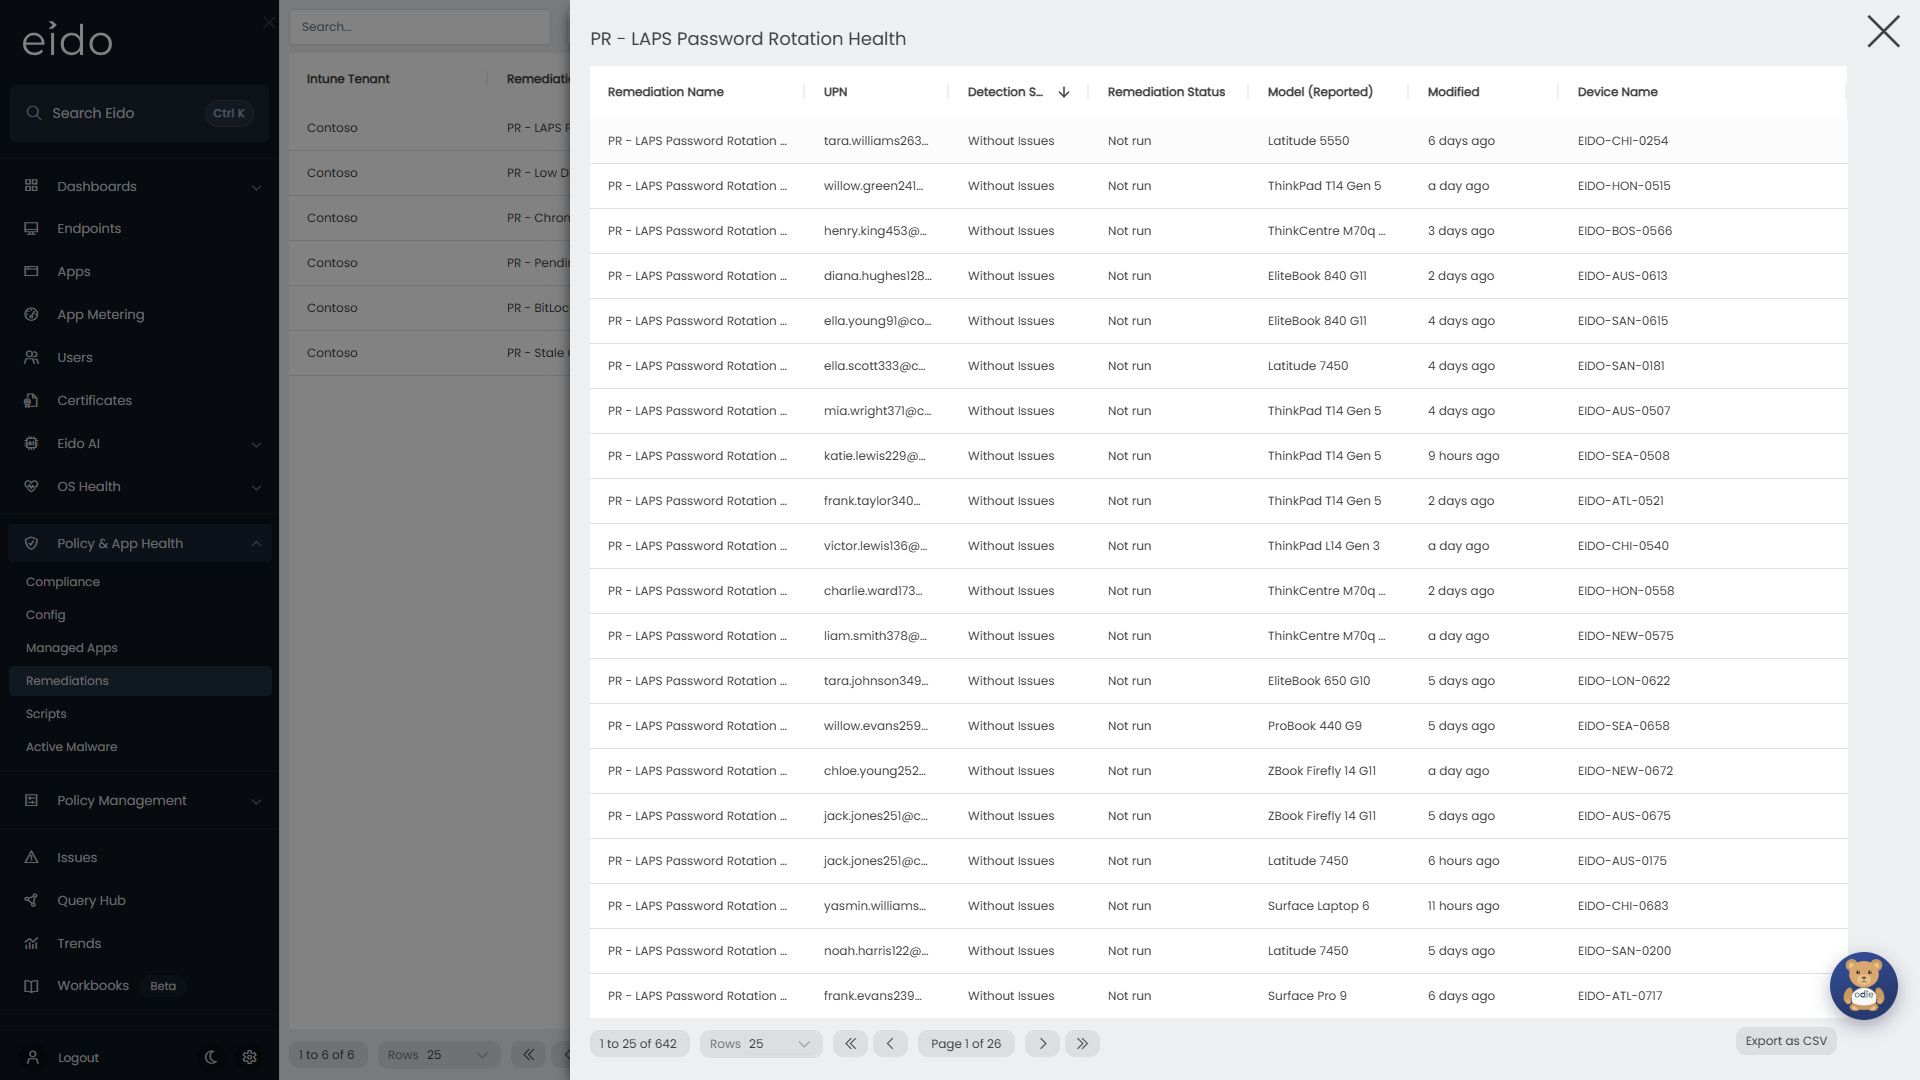
| Column | What it means |
|---|---|
| Remediation Name | The remediation you opened. |
| Device | The device’s name. |
| UPN | The user Intune reported the run against. |
| Detection Status | What the detection script found. |
| Remediation Status | What the fix did. |
| Model (Reported) | The device model Intune reported with the run. Useful when a remediation fails on one model only. |
| Modified | When Intune last updated this run. |
| Detection Status | Meaning |
|---|---|
| Pending | The device has not run detection yet. |
| Without Issues | Detection ran and found nothing wrong. |
| With Issues | Detection found the problem. |
| Failed | The detection script itself failed. |
| Remediation Status | Meaning |
|---|---|
| Not run | The fix has not run on this device. |
| Issue fixed | The fix ran and the problem is gone. |
| Recurred | The problem was fixed and has come back. |
| Failed | The fix script failed. |
| Timed out | The fix script did not finish in time. |
| Unknown | Intune did not report an outcome. |
If Intune reports an outcome Eido has no name for yet, the number Intune sent is shown instead.
Press a column heading to sort, for example by Model (Reported) to see whether the failures share a model. Export as CSV takes the whole list. Press a row to open the device in Device details.
Reading what the scripts printed#
The panel does not show script output. For that, open the Proactive Remediation Detail view in Query Hub and add the columns you need:
- Pre-Remediation Output and Pre-Remediation Error: what detection printed before the fix.
- Remediation Output and Remediation Error: what the fix printed.
- Post-Remediation Output and Post-Remediation Error: what detection printed afterwards.
You can filter on any of them, for example every device whose Remediation Error contains “Access is denied”. See Building a query.
Scripts#
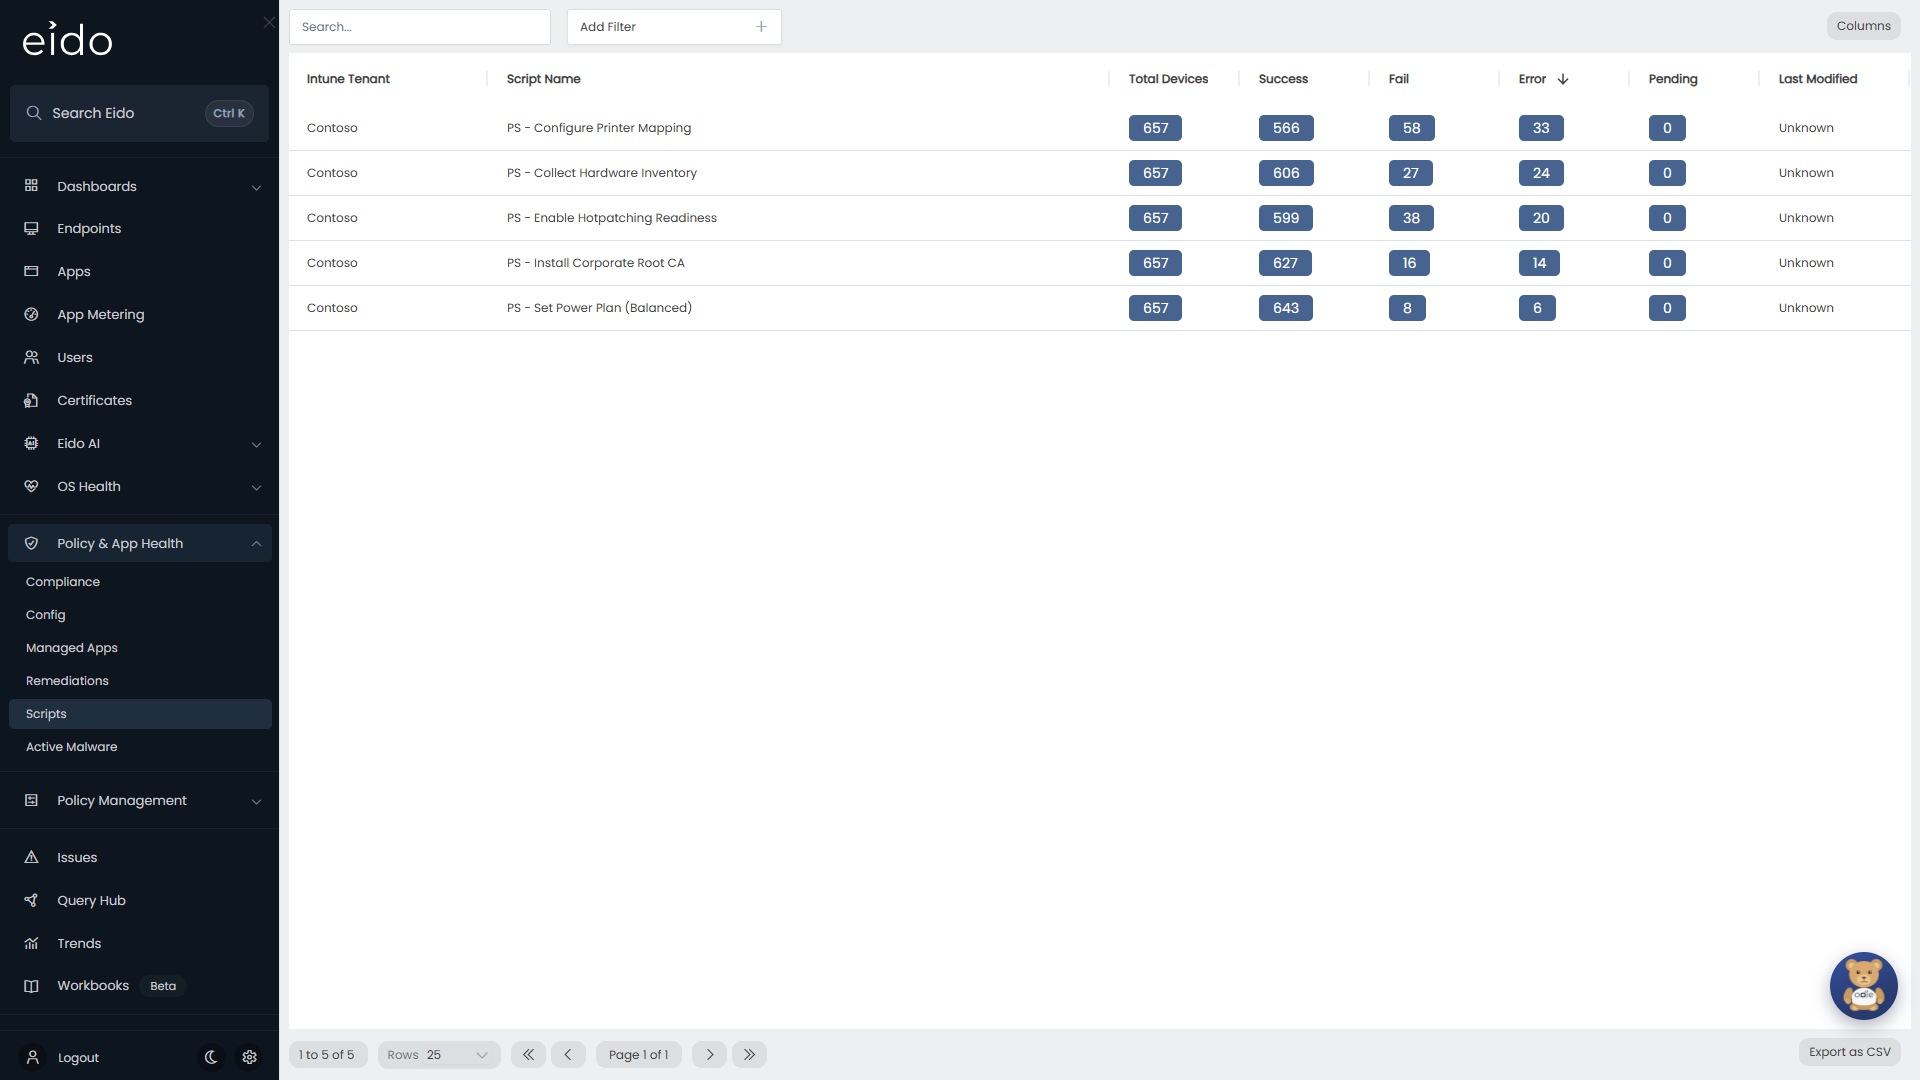
There is one row for each PowerShell script in each Intune tenant, sorted by Error, highest first.
| Column | What it counts |
|---|---|
| Customer | The customer the tenant belongs to. Only shown when you look after several customers and have not picked one. |
| Intune Tenant | The tenant the script lives in. |
| Script Name | The script’s name in Intune. |
| Total Devices | Devices that have reported a run state for this script. |
| Success | Devices where the script ran and succeeded. |
| Fail | Devices where Intune reports the run as failed. |
| Error | Devices where Intune reports an error running it. |
| Pending | Devices that have not reported a result yet. |
Unlike remediations, a device is counted in one outcome column only.
The devices behind a script#
Press a script to open its devices.
| Column | What it means |
|---|---|
| Script Name | The script you opened. |
| Device | The device’s name. |
| UPN | The user Intune reported the run against. |
| Run State | Success, Fail, Error or Pending, as Intune reports it. |
| Result State | Intune’s result for the run. |
| Error Code | The error code Intune recorded, if any. |
| Modified | When Intune last updated this run. |
Sorting, exporting and opening a device work as they do for remediations.
The Script Run State Detail view in Query Hub has more columns for the same rows, including Result Detail, Error Description, Policy Version and OS Version (Reported).
Finding your way around both lists#
- Search… matches any part of the name.
- Add Filter narrows the list by Customer, Intune Tenant, or Remediation Name (or Script Name).
- Press a column heading to sort.
- Columns opens Select Columns to show, hide and reorder columns. Reset to Defaults puts them back. Your layout is remembered.
- Export as CSV downloads every matching row with the columns you have showing.
The same data elsewhere#
In Query Hub, Proactive Remediations and Script Run States are these two lists, and Proactive Remediation Detail and Script Run State Detail are the rows for each device, with every device column available for filtering and grouping. Proactive Remediation Summary and Script Run State Summary are ready-made reports under Policy Health.
For one device, Device details has a Remediations section and a Scripts section with that device’s results.
Why does it show that?#
The list is empty#
Either the tenant has no remediations or scripts in Intune, or Backup Policies is off for the tenant. Eido learns which remediations and scripts exist from the policies it backs up, so with that switch off it has nothing to ask Intune about. Switch it on in Tenant settings and wait for the next sync.
A remediation or script is missing#
A remediation or script appears once at least one device has reported a run of it, and once Eido has synced the tenant since. One that was added to Intune within the last hour or so, or that no device has run yet, is not listed.
The remediation columns add up to more than Total Devices#
A device is counted in every column that is true for it. See Remediations.
A device that keeps being fixed is not in its own column#
A device with a Remediation Status of Recurred is counted under Issue Found, because detection has found the problem again. Open the remediation and sort by Remediation Status to see those devices.
My macOS shell scripts are not here#
Scripts lists Windows PowerShell scripts. Shell scripts for other platforms are not included.
The counts are higher than the rows I can open#
The list counts every device Intune reported a run for. The rows behind a remediation or script are limited to devices that are in Eido today, so a run on a device that has since been removed from Intune, or that is outside your device scope, is counted and not listed.