
A query becomes a report when you save it. A saved report keeps the recipe, not the results: the view, columns, filters, grouping and chart settings. Every time somebody opens it, it runs again against the latest data.
Anybody who can use Query Hub can save reports. What you can do to a report afterwards depends on whether it is yours.
| The report is | Run it | Save your own copy | Change or delete it |
|---|---|---|---|
| Built in (System) | Yes | Yes | No |
| Shared by somebody else | Yes | Yes | No |
| Yours | Yes | Yes | Yes |
Save a query as a report#
-
Build the query and press Preview
See Building a query. Make sure the results are what you expect before saving.
-
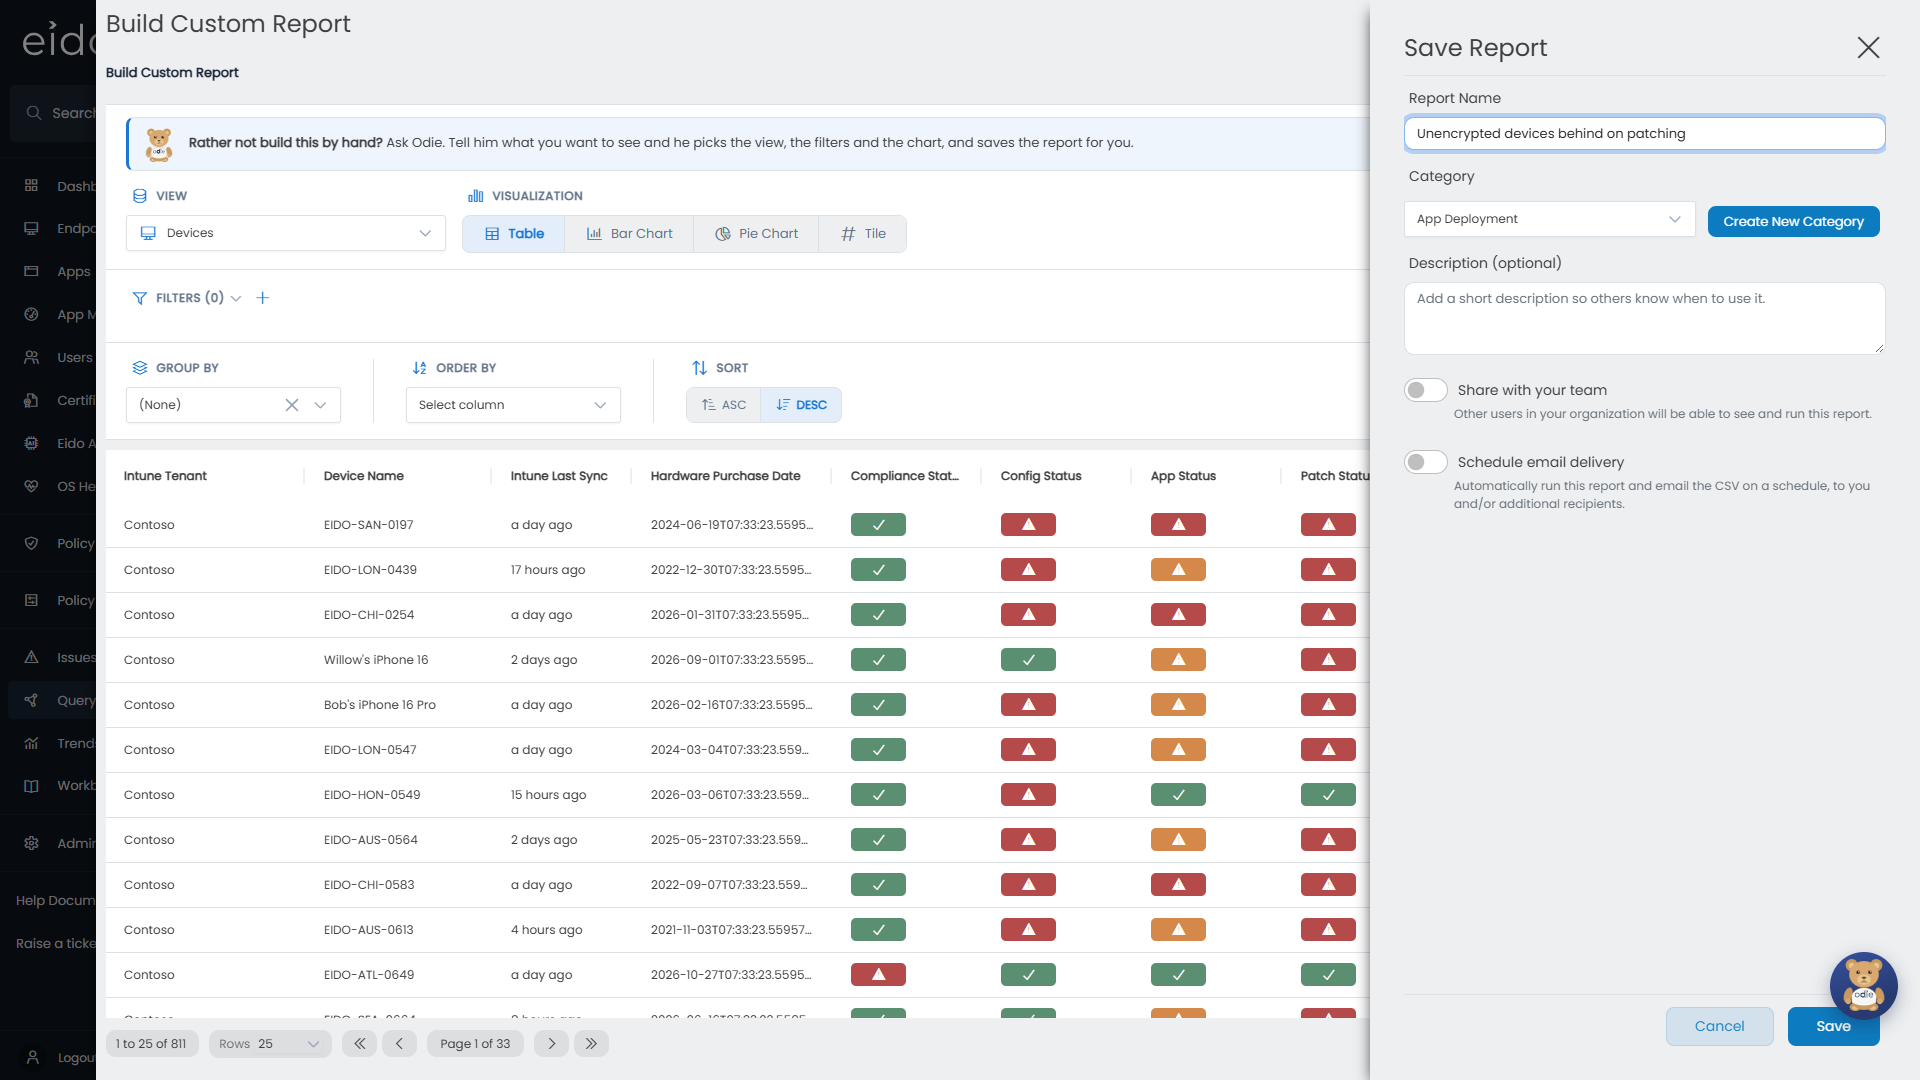
Press Save As
The Save Report panel opens.
-
Give it a Report Name
-
Choose a Category
Pick one of the existing categories, or press Create New Category and type a name. The category decides where the report sits in the library. Choose an existing category takes you back to the list.
-
Add a Description
Optional, but it is what other people read on the report’s card to decide whether it is the one they want.
-
Decide who sees it and whether it is emailed
Share with your team and Schedule email delivery are both covered below. A report can be one or the other, not both.
-
Press Save
The report appears on the Query Hub page under My Reports, in the category you chose.
What is saved, and what is not#
| Saved with the report | Not saved |
|---|---|
| The view and the visualisation | The rows themselves |
| The columns you ticked | How many rows per page you chose |
| Every filter | Column widths, or columns you dragged to a new position |
| Group By, the date bucket, Top and the aggregations | |
| Order By and the direction | |
| On click and the Drill into levels | |
| Slice colours, and a tile’s colour and rules |
Who can see a report#
A new report is private. Only you see it.
Switch on Share with your team, or the Shared switch in the report’s header later, and it appears under Shared With You for your colleagues, with your name on the card. They can run it and save their own copy. Only you can change or delete it.
Sharing a report shares the recipe, never the data. Each person who runs it sees only the devices, users and customers their own role allows, so the same shared report can show different rows to different people. Somebody whose role blocks the view the report reads does not see the report at all. See Roles.
If you manage several customers#
A report belongs to wherever you were working when you saved it.
- Saved with no customer selected, it belongs to your organisation as a whole. Sharing it shares it with colleagues working at that level.
- Saved while working inside a customer, it belongs to that customer. You, and anybody you share it with, see it only when working inside the same customer.
If a report you expect is not in the library, check which customer you are working in. See Customers overview.
Change a report#
Open the report from its card with the pencil, or press Run and then Edit.
For a report you own, the header becomes editable:
| In the header | How to change it |
|---|---|
| The category | Press it, then pick a category from the list or type a new one. |
| The name | Press it and type. Enter keeps the change, Esc abandons it. |
| Shared | Switches sharing on or off. |
| Schedule | Switches the scheduled email on or off, and sets how often. |
| The description | Press it, or Add description if there is none. Ctrl+Enter keeps the change, Esc abandons it. |
Change the query itself in the builder below, and press Preview to check it.
Nothing is kept until you press Save, and that includes the name, the category and the two switches. Cancel Edit puts everything back as it was last saved. Save As keeps your changes as a new report and leaves this one alone.
For a built-in report, or one somebody else shared, only Save As is offered.
Delete a report#
Press the bin on the report’s card, or Delete in the header while editing, and confirm. Only your own reports can be deleted, and a deleted report cannot be brought back.
Deleting a report does not affect dashboard widgets or workbook sections that were made from it. Those are copies.
Export to CSV#
Export as CSV is at the right of the bar under any table.
- Every matching row is exported, not just the page on screen. There is no row limit.
- Only the columns you are showing are included, in the order the table shows them by default.
- Headings are the column names you see on screen, such as “Primary User Department”, not internal field names.
- Dates and times are in your browser’s time zone, written as year, month, day, hour and minute.
- The file is named after the report.
While the file is being put together the table is covered by “Preparing your export. Large exports can take a few minutes.” A very large view can take that long. Leave the page open until the download starts. A second export cannot be started while one is running.
Exporting a grouped table#
If the table is grouped, the export contains what you see: one line per group, a column for the grouping value and a column for each aggregation, under the same headings. Top and the Other line are honoured. To export the rows behind the groups instead, clear Group By first.
Charts, tiles and Excel#
Bar charts, pie charts and tiles have no export. Switch the visualisation to Table to export the figures behind a chart.
There is no separate Excel format. A CSV file opens in Excel directly.
Put a report on a dashboard#
Reports are added to dashboards from the dashboard, not from Query Hub. While editing a dashboard, add a widget and choose Existing report, then pick the report from the list. Built-in, shared and your own reports are all offered.
The widget is a copy of the report as it was at that moment. Changing the report later does not change the widget, and changing the widget does not change the report. See Building a dashboard.
Have a report emailed on a schedule#
A table report can be emailed as a CSV attachment every day, week or month.
-
Switch on Schedule email delivery
It is in the Save Report panel when you first save, and is the Schedule switch in the header of a report you own.
-
Choose how often
Frequency Then choose Sent Daily An hour, from 00:00 UTC to 23:00 UTC. It starts on 08:00 UTC. Every day at that hour. Weekly A day of the week. It starts on Monday. Just after midnight UTC on that day. Monthly A day of the month, from the 1st to the 28th. Just after midnight UTC on that day. -
Choose who receives it
Send a copy to me (the owner) is on to begin with. Under Additional recipients, type an email address and press Add for anybody else. They do not need an Eido account. A schedule needs at least one recipient.
-
Press Save
Each email is titled “Scheduled Report” followed by the report’s name, with the CSV attached.
What to know about scheduled reports#
- Only table reports can be scheduled. The switch is greyed out for charts and tiles, and changing a scheduled report to a chart switches its schedule off.
- A shared report cannot be scheduled. Switching on one switches off the other. To have both, save a second copy.
- The email always contains rows. If the report is grouped, the grouping is ignored and the matching rows are sent.
- It runs as you. The file holds what you are allowed to see, whoever receives it. Think about that before adding recipients outside your team.
- It holds up to 250,000 rows.
- It stops if your account does. If the owner’s account is removed or suspended, the report is no longer sent.
- Times are UTC. Work out the hour in your own time zone, and remember that it shifts by an hour when your clocks change.
- The first email can arrive within minutes. A new schedule sends its first report straight away if the chosen hour has already passed today (daily) or the chosen day has already passed this month (monthly). A weekly schedule always sends its first report straight away. The schedule carries on from there.
Recipients are chosen when the report is first saved. To send an existing scheduled report to different people, open it, press Save As to make a new report with the right recipients, and delete the old one.
A report card in the library shows a Scheduled badge. Hover over it for the frequency.
Regular bulk exports#
A scheduled email suits a report that people read. To feed another system, such as a data warehouse or a reporting tool, an administrator can set up an export job instead. It writes whole views to your own Azure storage as CSV or JSON, as often as every hour. See Export jobs.
Questions#
Why is there no Save button, only Save As?#
The report is not yours. Built-in reports and reports shared by other people are read only. Save As gives you a copy you can change.
I changed the report’s name but it changed back. Why?#
The name, category, description and switches in the header are only kept when you press Save. Closing the panel or pressing Cancel Edit discards them.
Why is the Schedule switch greyed out?#
Hover over it for the reason. Either the report is shared, or it is not a table.
Why does my export have fewer columns than the view?#
The export follows the table. Tick the columns you want in the Columns panel, press Preview, then export.
Why does a colleague see different rows in my shared report?#
Their role limits them to different devices, users or customers. The report is the same. The data each of you is allowed to see is not.
Can I share a report with just one person?#
No. A report is either private or shared with everybody who works where it was saved. To send the results to one person, schedule it to their email address or export it.
Why did the scheduled email not arrive?#
Check that the report still shows the Scheduled badge, that it is still a table and not shared, and that it has a recipient. Then check the recipient’s junk folder. If it still does not arrive, contact support.