
A dashboard is a page of widgets: tiles, lists, charts and tables that each answer one question about your devices. The first page you see after signing in is your default dashboard. Everybody who can sign in to Eido has dashboards, and each person can have as many as they like.
Dashboards show the state of your estate as of the last sync with Intune. They are for looking and clicking through. To change one, see Building a dashboard.
Open a dashboard#
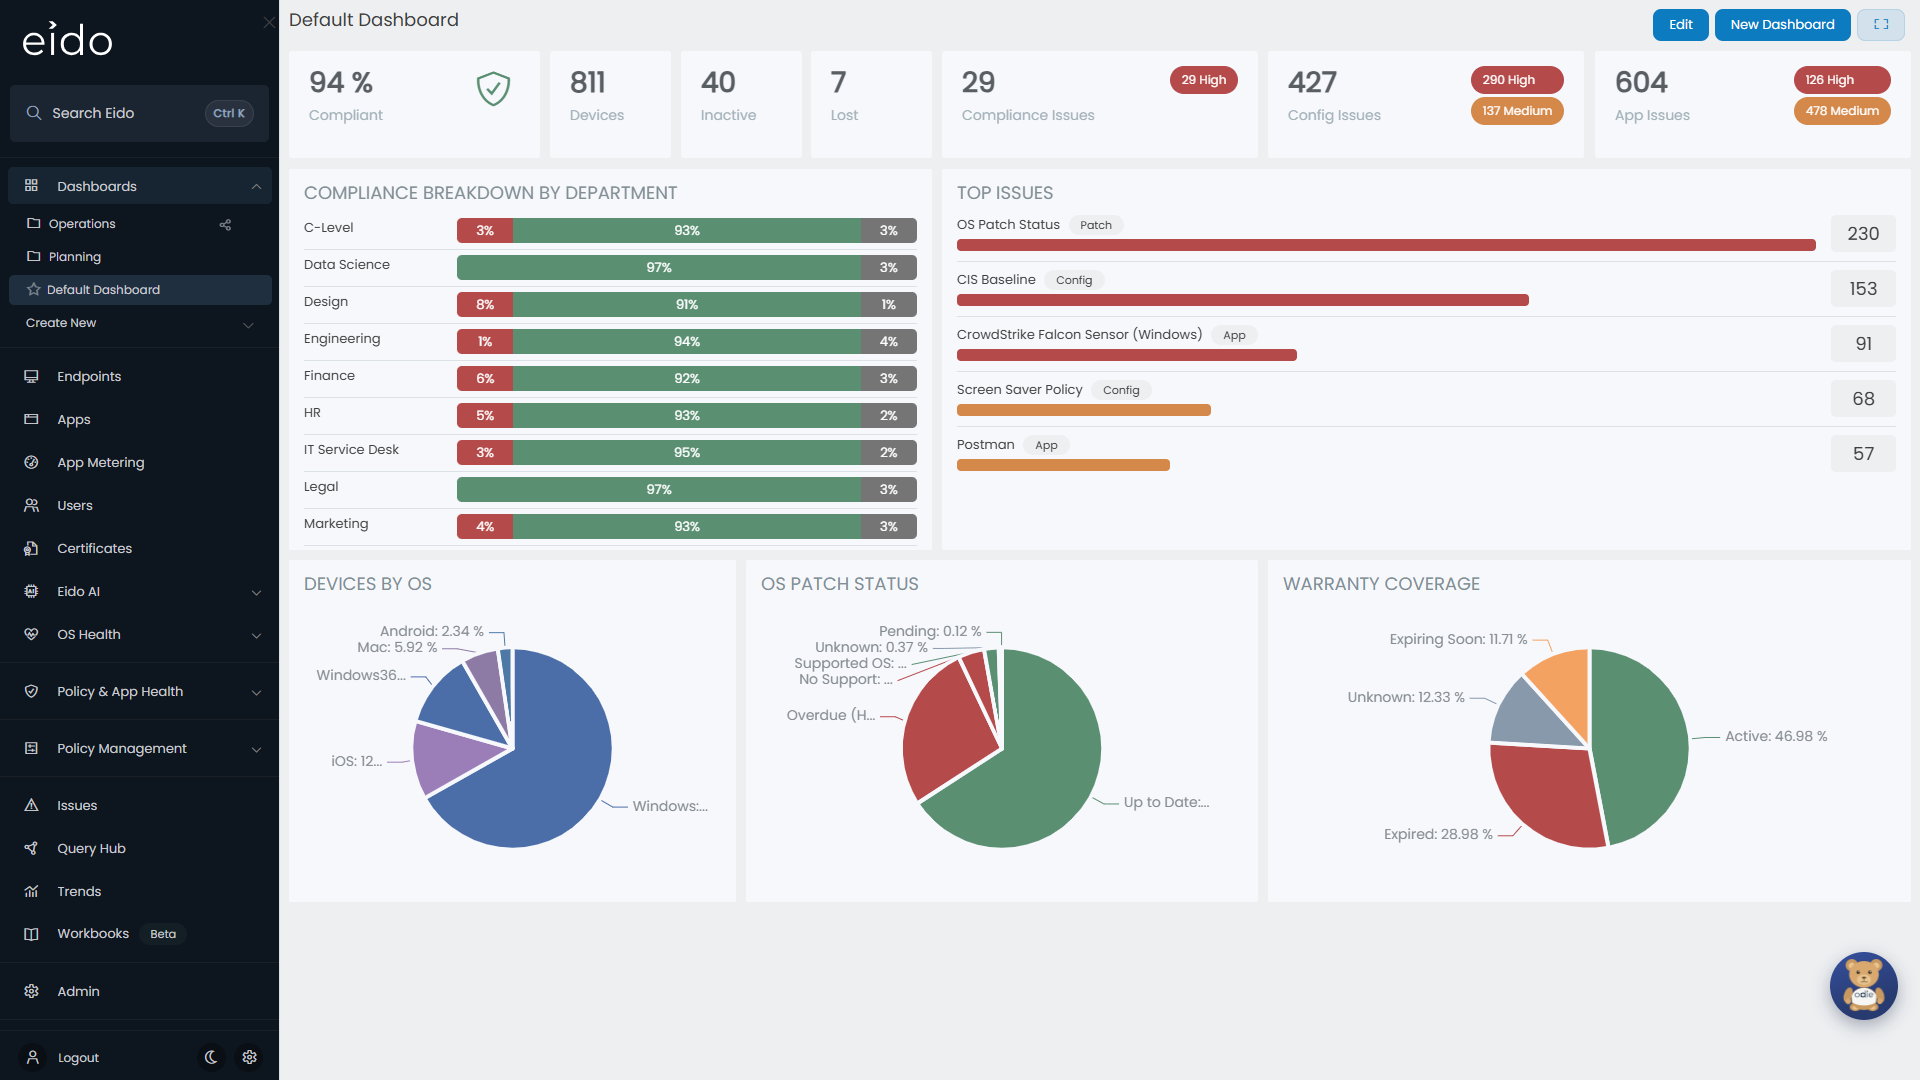
Press Dashboards in the sidebar to open the list. It holds:
- Any folders, each of which opens to show the dashboards inside it.
- Your own dashboards, and dashboards other people have shared.
- Show hidden dashboards, if you have hidden any.
- Create New, for a new dashboard or a new folder.
A star beside a name marks your default dashboard. Press a name to open that dashboard.
Your default dashboard#
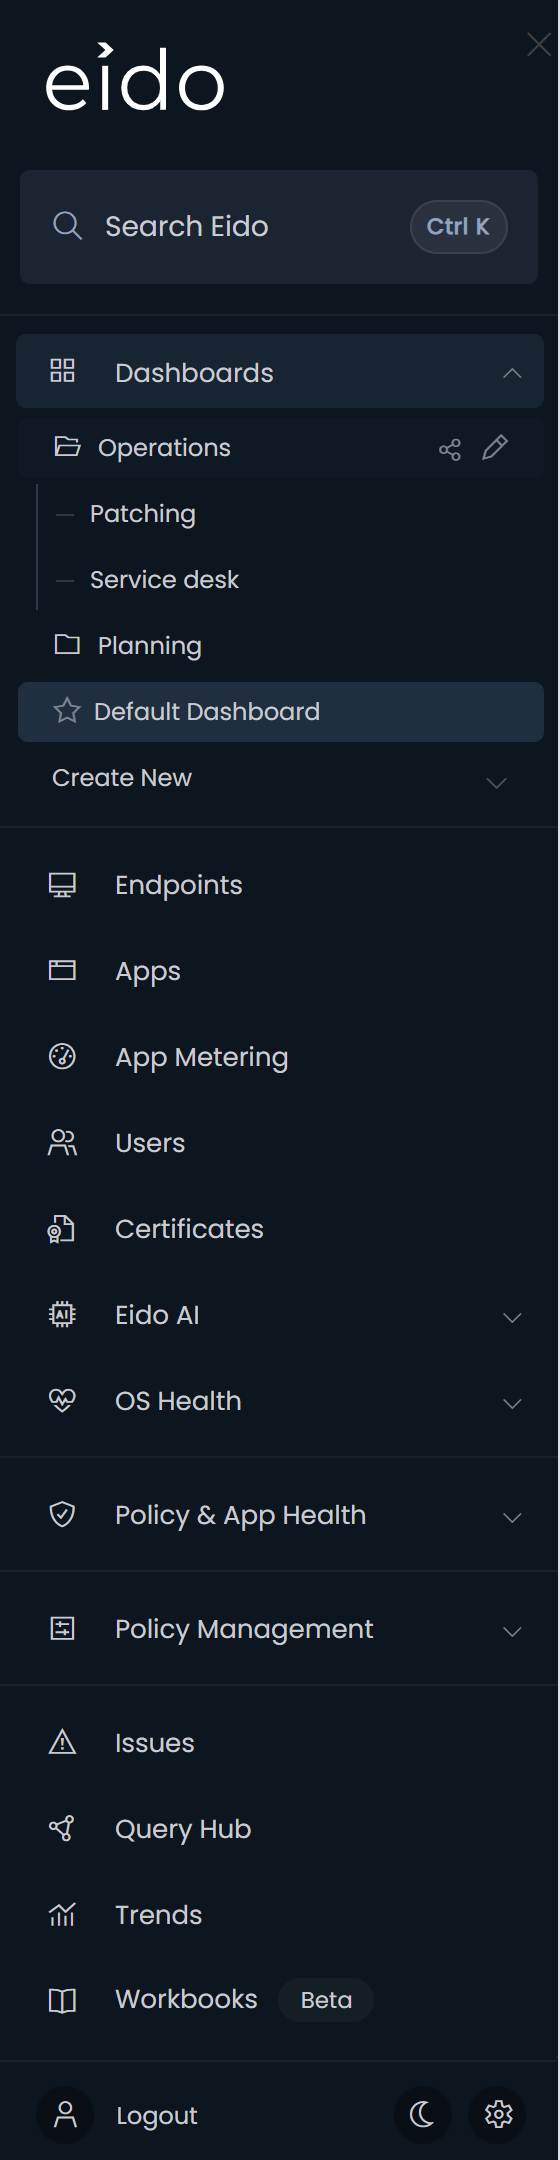
The first time you sign in, Eido makes a dashboard for you called Default Dashboard and fills it with a standard set of widgets:
- Seven tiles: Compliant, Devices, Inactive, Lost, Compliance Issues, Config Issues and App Issues.
- COMPLIANCE BREAKDOWN BY DEPARTMENT and TOP ISSUES.
- Three charts: DEVICES BY OS, OS PATCH STATUS and WARRANTY COVERAGE.
It is yours to change. You can also make any other dashboard of your own the default, see Set your default dashboard.
The top of the page#
| Control | What it does |
|---|---|
| The name | The dashboard you are looking at. |
| Shared with you | Shown in place of Edit on a dashboard that belongs to somebody else. Hover over it to see who owns it. |
| Edit | Opens the dashboard for editing. Only on dashboards you own. |
| New Dashboard | Starts a new dashboard. |
| The expand button | Hides the sidebar and puts the browser in full screen. Press it again to come back. |
The built-in widgets#
The built-in widgets come from the widget gallery. Their headings are fixed.
Tiles#
| Tile | What it counts | A click opens |
|---|---|---|
| Compliant | The percentage of devices whose compliance status is healthy. Devices managed only by Configuration Manager are left out of both sides of the sum, because Intune never evaluates compliance for them. | Endpoints, filtered to devices that are not compliant. |
| Devices | Every device on the Endpoints list. | Endpoints. |
| Inactive | Devices that have not synced with Intune for more than 30 days. | Endpoints, filtered to inactive devices. |
| Lost | Devices with lost mode switched on. | Endpoints, filtered to those devices. |
| Compliance Issues | Open issues raised by compliance policies. | Issues, filtered to compliance. |
| Config Issues | Open issues raised by configuration policies. | Issues, filtered to configuration. |
| App Issues | Open issues raised by managed apps. | Issues, filtered to apps. |
The shield on the Compliant tile changes colour with the figure:
| Colour | Compliant |
|---|---|
| Green | 90% or more |
| Amber | 80% up to 90% |
| Red | Below 80% |
The three issue tiles count issues at High and Medium severity. On a wide screen each also shows the split, as a red High chip and an amber Medium chip.
Top lists#
TOP ISSUES, TOP COMPLIANCE ISSUES, TOP CONFIG ISSUES and TOP APP ISSUES each list the five policies or apps with the most devices affected by an open issue.
- The name is the policy or app, with its type beside it.
- The number on the right is how many devices are affected.
- The bar is longer the more devices are affected, and takes the colour of the worst severity: red for High, amber for Medium.
Press a row to open Issues filtered to that one policy or app.
Tables#
| Widget | What it lists | The figure on the right |
|---|---|---|
| NEW DEVICES | The ten most recently enrolled devices. | How long ago the device enrolled. |
| INACTIVE DEVICES | Ten devices that have not synced for more than 30 days, longest first. | When the device last synced. |
| LONGEST NON COMPLIANT | The ten devices with the oldest open compliance issue. | When that issue started. |
| DEVICES WITH MOST ISSUES | The ten devices with the most open issues. | The number of open issues. |
Press a row to open that device, see Device details. A table with nothing to list shows No Data.
Charts#
Each chart is a pie of your devices, or of your open issues, split one way.
| Chart | Split by | A click on a slice opens |
|---|---|---|
| DEVICES BY OS | Operating system | Endpoints, filtered to that operating system |
| DEVICES BY MANUFACTURER | Manufacturer | Endpoints, filtered to that manufacturer |
| DEVICES BY MODEL | Model | Endpoints, filtered to that model |
| ENCRYPTION | Encrypted or not | Endpoints, filtered to that state |
| DEVICES BY OWNERSHIP | Who owns the device, as Intune records it | Endpoints, filtered to that ownership |
| OS PATCH STATUS | Patch status | Patch Compliance, filtered to that status |
| WARRANTY COVERAGE | Warranty status | The warranty report, filtered to that status |
| ISSUES BY DEPARTMENT, OFFICE, COUNTRY or STATE | The department, office, country or state of the device’s primary user | Issues, filtered to that value |
Devices or issues with no value for the split are gathered into a slice called Unknown.
Breakdowns#
COMPLIANCE BREAKDOWN BY DEPARTMENT, BY OFFICE, BY COUNTRY and BY STATE show one row for each department (or office, country or state), taken from the device’s primary user. Each row is a bar divided by compliance status, with the percentage written on each part:
- Green: healthy.
- Amber: unhealthy, Medium.
- Red: unhealthy, High.
- Grey, on the department breakdown: unknown.
Hover over a part of a bar for the number of devices. Press it to open Endpoints filtered to that status and that department. As on the Compliant tile, devices managed only by Configuration Manager are left out.
Custom widgets#
A dashboard can also hold widgets that somebody built from a Query Hub query. They carry the title their author gave them and appear as a table, a bar chart, a pie chart or a single-number tile.
- Press a bar, a slice or a tile to open a panel listing the rows behind it. Open in QueryHub in that panel takes the same query into the report builder.
- Press a row in a table widget that lists devices to open the device.
How to build one is in Building a dashboard.
Dates and refreshing#
The built-in widgets have no date range. They show how things stand now: open issues, current devices, current statuses. For how a figure has moved over time, use Trends. A custom widget can carry a date filter of its own, set by whoever built it.
A dashboard left open refreshes its built-in widgets every ten minutes. Reload the page to refresh everything straight away.
Which devices a dashboard covers#
A dashboard counts the devices you are allowed to see. If your role is limited to certain customers or tenants, the figures cover only those.
If your organisation manages several customers, the customer picker at the top of the sidebar also decides which dashboards you have. All Customers has its own list of dashboards and its own default. Each customer you select has a separate list, with a separate default that Eido creates the first time you open it, and every widget counts that customer’s devices only. See Customers overview.
On a shared screen#
The expand button is enough for a meeting. For a screen on a wall that should rotate through dashboards without anybody signed in, an administrator can set up a wallboard.
Common questions#
Why does a widget say “Widget unavailable”?#
The message continues: “You may not have access to the data behind this widget.” The dashboard was probably shared by somebody whose role lets them see data that yours does not. A custom widget in the same position says Unable to load widget. Ask an administrator to check your role, see Roles.
Why is there no Edit button?#
The dashboard belongs to somebody else and shows Shared with you instead. Only the owner can change a dashboard. To have your own version, create a new dashboard and add the same widgets.
Why is the Compliant figure different from the one in Intune?#
The tile leaves out devices managed only by Configuration Manager, and it counts a device as compliant when its compliance status in Eido is healthy. A device with an unknown compliance status counts against the percentage.
Why can I not see the High and Medium chips on the issue tiles?#
They are only drawn when the browser window is wide enough. The total on the tile is always there. Widen the window, or press the tile to see the issues themselves.
Why did the dashboards in the sidebar change?#
You selected a different customer. Each selection in the customer picker has its own dashboards and folders.