
The query builder is where a report is made. You choose a view (a set of data, such as devices or issues), choose which of its columns to show, narrow the rows with filters, and decide whether the answer is a table, a chart or a single number.
Anybody who can open Query Hub can build a query. There are three ways in:
- Build Custom Report on the Query Hub page, for an empty query.
- The pencil on any report card, to start from that report.
- Open in QueryHub, at the top of the panel of rows that opens when you press a bar, a slice, a tile or a grouped row. It carries the rows you were looking at into the builder.
This article covers views, columns and the results table. Filters, grouping and charts have their own article.
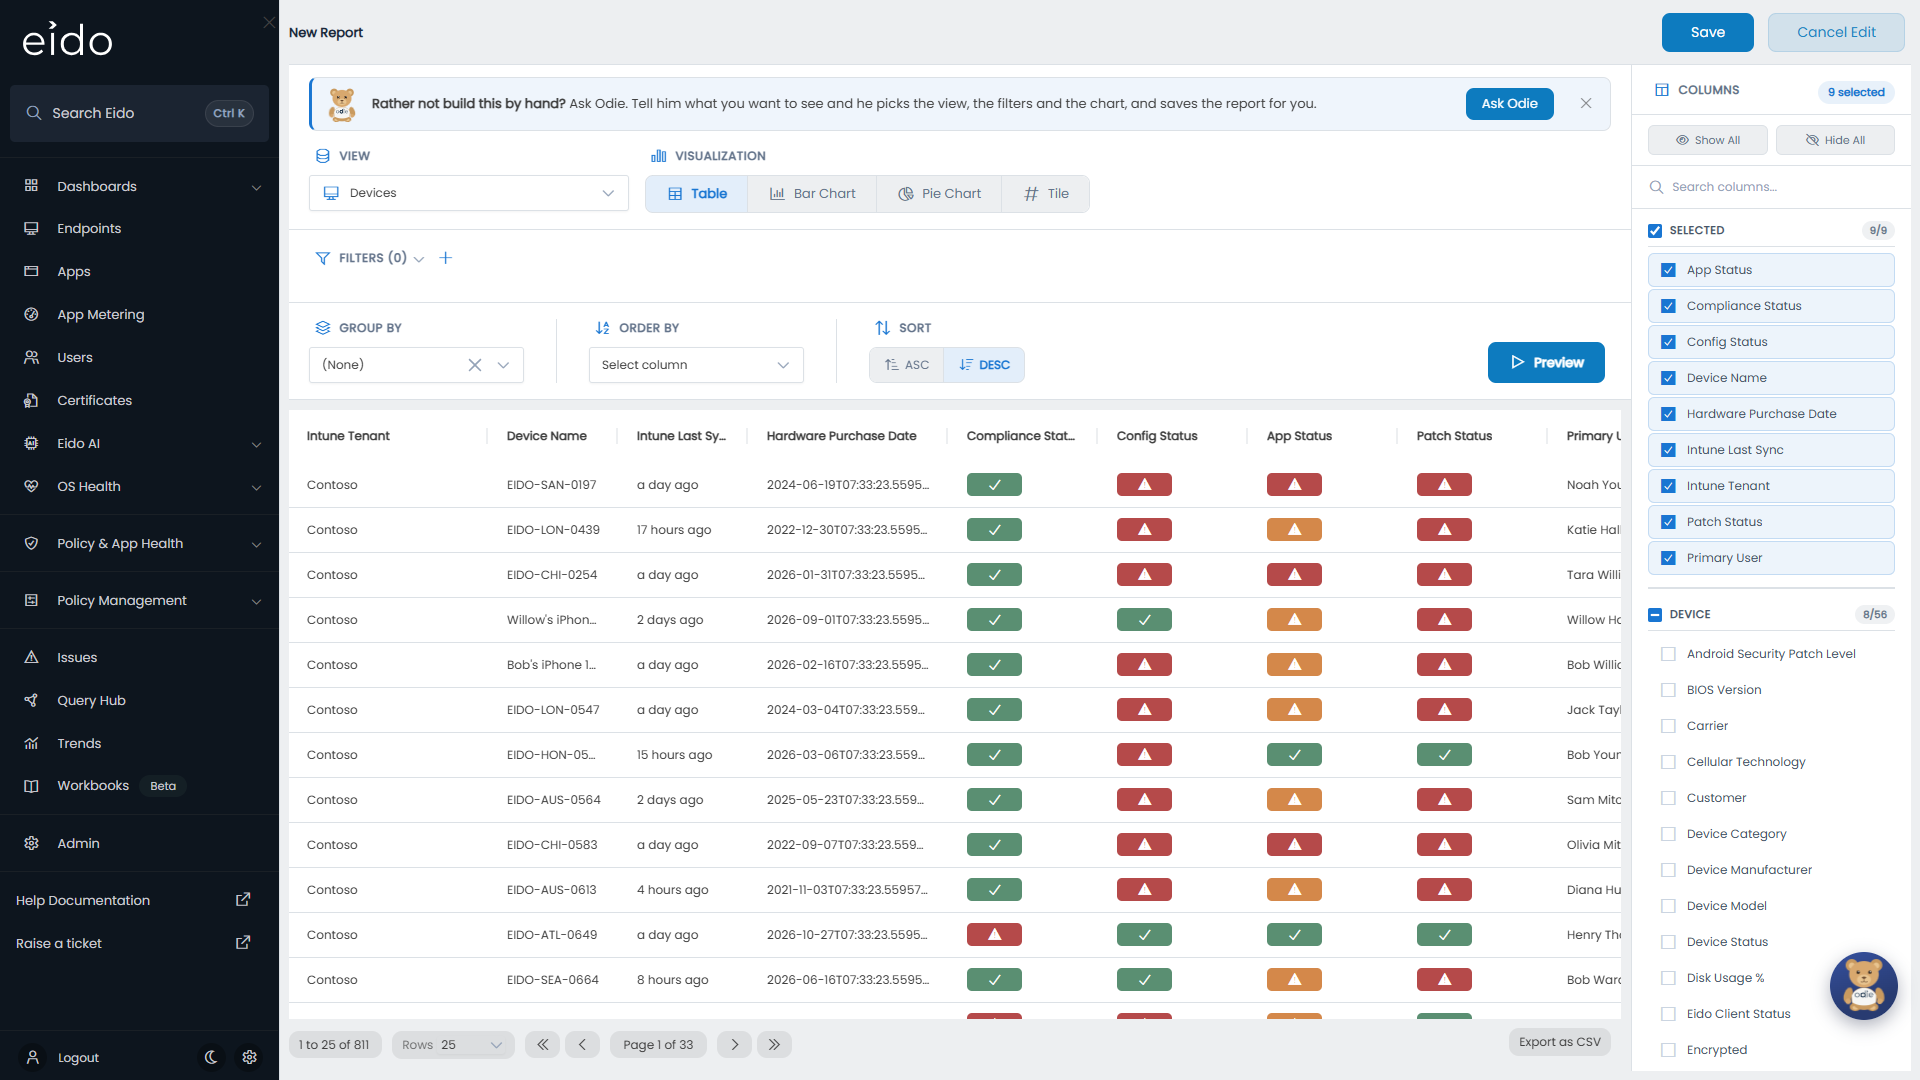
The parts of the builder#
| Part | What it is for |
|---|---|
| View | The set of data the query reads. |
| Visualization | Table, Bar Chart, Pie Chart or Tile. |
| Filters | The conditions a row has to meet to be included. |
| Group By, Order By, Sort | Grouping and ordering. Not shown for a tile. |
| Preview | Runs the query as it now stands. |
| Columns | The columns a table shows. Only there for an ungrouped table. |
| The results | The table, chart or tile, below the options. |
Most changes do not take effect until you press Preview. Until then the results area says “Click Preview to see results”. Sorting by a column heading and moving between pages are immediate.
Choose a view#
Open the View list and pick one, or type into Search views…. The builder opens on Devices.
A view is a ready-made table. You do not join views together yourself. Instead, every view that is about devices already carries the device’s own columns and its primary user’s columns alongside its own, so a query on, say, Device Issues can filter by the device’s model or the user’s department without any extra work.
Choosing a different view starts a new query. Filters, columns and grouping go back to that view’s defaults, and the builder is no longer tied to the report you opened.
You are offered only the views your role allows. See Roles.
Devices and users#
| View | One row is | Holds |
|---|---|---|
| Devices | A managed device | Health in each area (compliance, configuration, apps, patching), hardware, operating system, encryption, warranty, enrolment, update ring and the primary user. |
| Deleted Devices | A device that is no longer in Intune | The device’s last known details and Deleted At, which is when Eido first found it gone. |
| Users | A user | Their details from Entra, how many devices they have, which ones, and the worst status across them in each area. |
| Device Issues | An issue on a device | Severity, category, type, when it started and ended, and whether it is open. Opens showing open issues only. |
| Autopilot Deployments | A Windows Autopilot deployment | Profile, deployment state, each Enrollment Status Page stage, failure details and how long it took. |
| OS Support | An operating system version and edition in a tenant | How many devices run it, whether it is supported and when support ends. |
| Lenovo Product Info | A Lenovo device | Factory specification: processor, memory, storage, graphics and the warranty it shipped with. Needs the Lenovo warranty integration. |
Windows updates and drivers#
| View | One row is | Holds |
|---|---|---|
| Device Patch Status | A device and a security patch | Whether that patch is installed, pending, deferred or overdue on that device, with release date, estimated offer date and days outstanding. Covers security updates from the last 18 months. |
| Windows Drivers | A driver in a driver update profile | Manufacturer, version, class, approval status, how many devices it applies to, and the profile and groups it belongs to. |
| Driver Update Failures | A driver update failure on a device | The driver, the policy, the error code, and whether the failure is still active. |
Policies#
| View | One row is | Holds |
|---|---|---|
| Policies | A policy | Type, whether Eido’s copy is in step with Intune, and how it compares with its template. |
| Policy Templates | A policy template | Versions, how many policies are deployed from it, drift and how many are behind the latest version. |
| Compliance Policies, Configuration Policies | A policy | How many devices and users it is deployed to, and how many of those are healthy, unhealthy or unknown. |
| Compliance Policy Detail, Configuration Policy Detail | A policy on a device | Assignment status, type and state, and when it was first seen. |
| Policy Settings | A setting in a policy | The setting, its value and the policy it belongs to. |
| Policy Settings History | A value a setting has had | The value, when it applied from and to, and for how many days. |
| Policy Setting Assignments | A setting delivered to a device | The value, the policy, and how many policies and distinct values reach that device for the same setting. |
| Proactive Remediations, Script Run States | A remediation or a script | Counts of devices in each outcome. |
| Proactive Remediation Detail, Script Run State Detail | A remediation or script on a device | Detection and remediation status, or run state and result, with the output and any error. |
| Intune Audit Logs | A change made in Intune | When, what, by whom, the result and the resources affected. |
Apps#
| View | One row is | Holds |
|---|---|---|
| Managed Apps | An app deployed from Intune | Version, type, supersedence, and how many deployments are healthy. |
| Managed App Detail | A managed app on a device | Assignment status, install reason, error code and last attempt. |
| Discovered Apps | An application found on devices | Publisher, platform, number of versions and total installs. |
| Discovered App Installs | An application version on a device | The version and the device it is on. A very large view, so it opens unsorted. Filter it before sorting. |
| VPP App Licenses | An Apple volume-purchased app | Total, used and available licences. |
| Apple Enrollment Certificates | An Apple certificate or token | Type, expiry date and status. |
| App Usage (Last 30 Days) | A metered application | Versions, devices, users and average hours per user over the last 30 days. Table and tile only. |
| App Usage (Daily) | A user on a device using an application on a day | Minutes and hours of use, and the person who was using it. |
| App Usage (Monthly) | A user on a device using an application in a month | Hours of use and the number of days it was used. |
| App Metering Diagnostics | A device reporting to App Metering | Certificate, script version, last heartbeat and audit settings. Table and tile only. |
The App Usage views hold data once App Metering is set up. See App Metering.
Security#
| View | One row is | Holds |
|---|---|---|
| Active Malware | A piece of malware | Category, severity, and how many detections are active and resolved. |
| Active Malware Detail | Malware on a device | Status, state, number of detections, and when it was first seen and resolved. |
| Defender Agents | A device’s Defender agent | Overall status, real-time and tamper protection, and whether signatures are overdue. |
| EPM Elevation Events | An elevation under Endpoint Privilege Management | The file, the user, the elevation type, the result and any justification. |
| Remote Assistance Sessions | A remote assistance record for a device | The number of sessions and when it was recorded. |
Eido itself#
| View | One row is | Holds |
|---|---|---|
| Audit Log | Something somebody did in Eido | When, who, the action, what it was done to and what changed. |
Views that appear when a feature is on#
| Views | Appear when | Hold |
|---|---|---|
| Those starting Inventory: | The Eido Client is enabled on at least one of your tenants. See The Eido Client. | What the client collects from each Windows device, one view per subject: system information, memory, installed apps, volumes and disks, network adapters, services, security posture, Defender, firewall, certificates, local users and profiles, runtimes, browsers and extensions, Office, OneDrive, start-up items, proxy, batteries, printers, Wi-Fi, WSL, Windows features, MDM health, Secure Boot and Windows 11 readiness. |
| Those starting Events: | The same. | Blue screens and unexpected shutdowns, application crashes, application install failures, and Intune and MDM errors. |
| Those starting Eido AI: | Eido AI is switched on. See Eido AI. | Intune changes, diagnostic sessions, script runs and recommendations. Eido AI: ServiceNow Incidents also needs the ServiceNow connection. See ServiceNow. |
Choose columns#
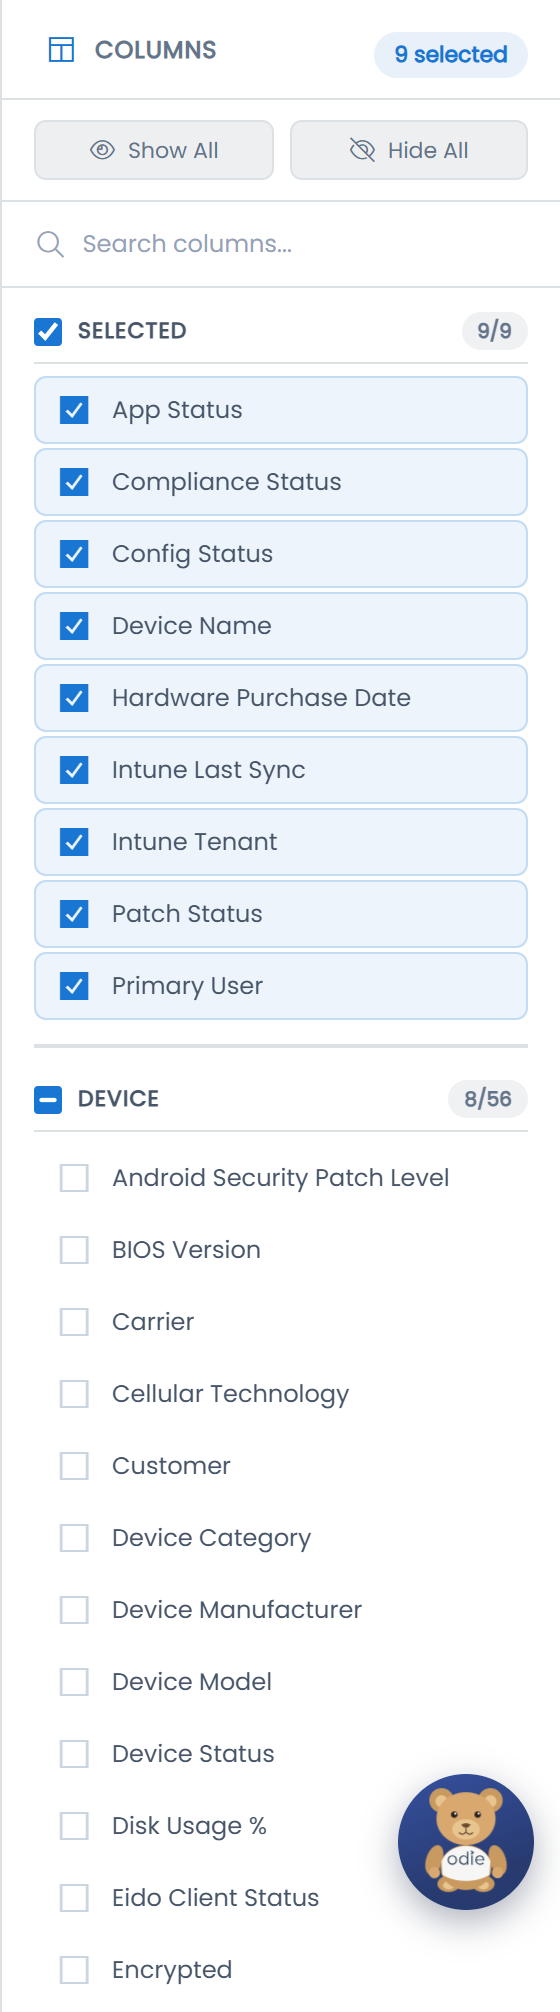
The Columns panel on the right lists every column the view has. It is there whenever the visualisation is Table and no Group By is set.
- Ticked columns are gathered at the top under Selected. The badge shows how many are selected.
- The rest are grouped by subject, the view’s own columns first, then the device’s and the primary user’s. Each group shows how many of its columns are selected, such as 3/12.
- Press a column to add or remove it. Tick a group’s box to add or remove the whole group.
- Search columns… finds a column by name across every group.
- Show All selects everything. Hide All leaves only the first column. A table always keeps at least one.
Any computed columns your administrator has created appear in a group called Computed.
The Customer column is offered only if your organisation manages several customers and you are not working inside one of them.
Press Preview to see the change.
The order of columns#
Columns appear in the order the view lists them, not the order you ticked them. You can drag a heading sideways to move a column, and drag the edge of a heading to resize it, while you work. That arrangement is for your eyes only: it is not saved with the report and an export does not follow it.
Sort the results#
There are two ways to sort a table, and they do the same thing.
- Press a column heading. The table re-sorts immediately. Press again to reverse it.
- Order By and Sort in the builder. Choose a column, then ASC or DESC, and press Preview. None removes the sort. Only the columns you are showing are offered.
A table sorts by one column at a time. The sort is saved with the report.
Read the results table#
The bar under the table has everything for moving around.
| Control | What it does |
|---|---|
| “1 to 25 of 3104” | Which rows you are looking at, and how many match in total. |
| Rows | Rows per page: 25, 50, 100 or 250. It starts at 25 each time you open the builder. |
| The arrows | First, previous, next and last page. |
| Page 1 of 125 | Where you are. |
| Export as CSV | Downloads every matching row. See Saving and exporting reports. |
Coloured badges in status columns use the same colours as the rest of Eido: green for healthy, amber for medium, red for high and grey for unknown.
Open the thing behind a row#
In views where a row is a device, or something on a device, pressing the row opens Device details for that device. That covers Devices, Deleted Devices, Device Issues, Autopilot Deployments, Device Patch Status, Discovered App Installs and every view with Detail in its name, among others. In Eido AI: Diagnostic Sessions, a row opens the session’s report.
In views where a row is a summary, such as Policies or Discovered Apps, rows do not open anything.
Questions#
Why is the view I want not in the list?#
Either your role does not allow it, or it belongs to a feature that is not switched on. The Inventory and Events views need the Eido Client, the Eido AI views need Eido AI, and Lenovo Product Info needs the Lenovo warranty integration.
Why did my filters disappear?#
You changed the view. A different view has different columns, so the builder starts again.
Why does nothing change when I tick a column?#
Press Preview. The builder waits so that you can make several changes and run the query once.
Why does the row count stop at 10,000 on Policy Setting Assignments?#
That view can hold a row for every setting on every device, so Eido stops counting at 10,000 to keep it quick. The rows themselves are all there: filter the view to bring the count below the limit.
Why is the Columns panel missing?#
It is only there for an ungrouped table. Set Visualization to Table and clear Group By.
Can I combine two views in one query?#
No. Pick the view whose rows are the thing you want to count, and use the device and primary user columns it already carries. If you need a value that no column has, an administrator may be able to add it as a computed column.