
Device details is everything Eido knows about one device, on one screen: who uses it, what it is, how it is patched, which policies and apps are assigned to it and how each one is doing. Service desk engineers use it to answer “what is wrong with this device?” without opening Intune.
Anybody who can see a device in Eido can open its details. Some sections only appear when an administrator has switched a feature on. The page says which.
Open a device#
Click a device anywhere it is listed: in Endpoints, in Patch Compliance, in the list of installs for an app, or in a Query Hub report that lists devices. The device slides in from the right, over the page you were on. Close it with the cross at the top right, or by clicking the dimmed page behind it.
The header#
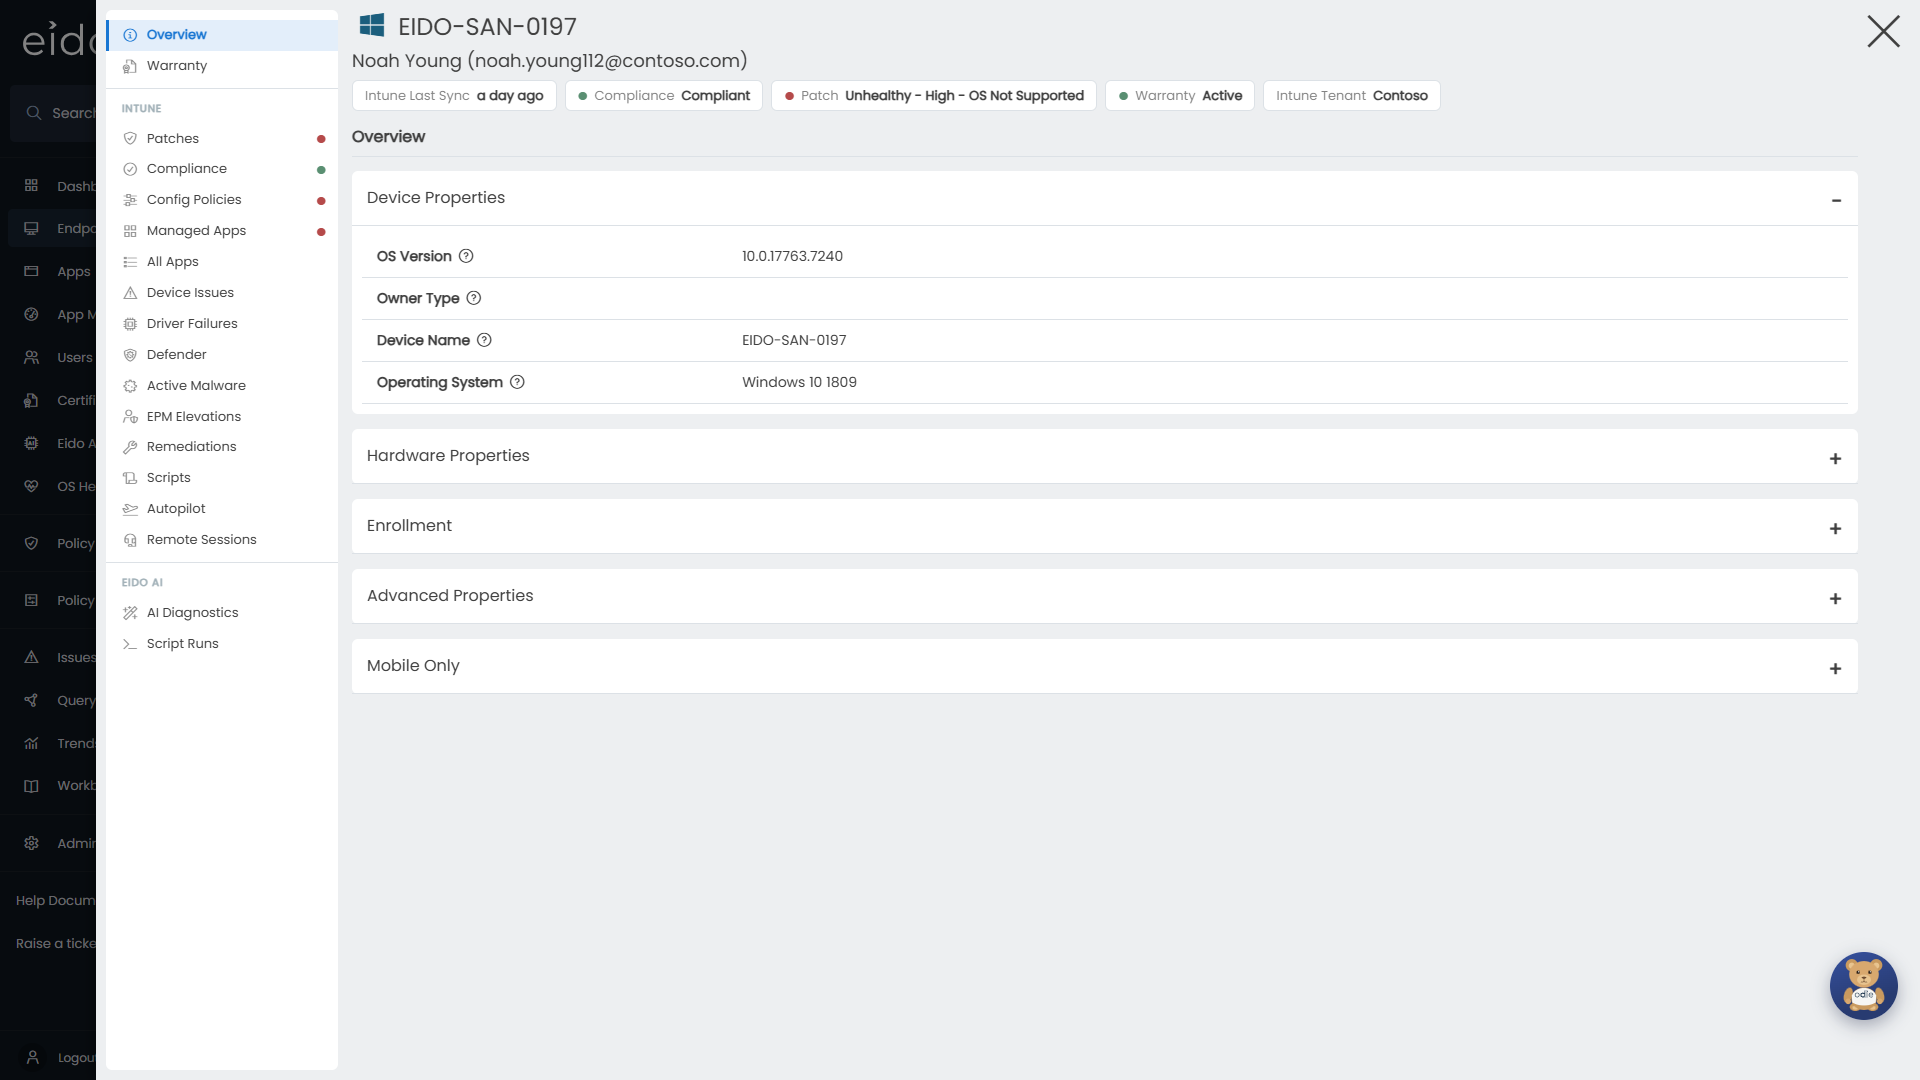
The top of the panel names the device and stays in view whichever section you open.
- An icon for the operating system, then the device name.
- Under it, the primary user and their email address.
Below that is a strip of chips. Each one is a headline fact, and most are buttons that jump to the section behind them.
| Chip | Shows | Pressing it opens |
|---|---|---|
| Intune Last Sync | How long ago the device last checked in with Intune. This is Intune’s check in, not the Eido Client’s. | Overview |
| Eido Client | Online (green) or Offline (red). Only shown when the device runs the Eido Client. Online means it has checked in within the last 15 minutes. | Device Metrics |
| Real-Time | The state of the live connection used for metrics and remote tools. Only shown when the device runs the Eido Client. | The Real-Time Channel panel |
| Compliance | Compliant, Non Compliant or Unknown. | Compliance |
| Patch | The device’s patch grade. OS Not Supported is added when the operating system has passed its end of support date. | Patches |
| Warranty | Active, Expired or Unknown. | Warranty |
| Customer | The customer the device belongs to, when your organisation manages several. | Nothing |
| Intune Tenant | The tenant the device was synced from. | Nothing |
The coloured dots follow the usual grades: green for healthy, amber for medium, red for high and grey for unknown. See What the status columns mean.
Devices deleted from Intune#
If the device has been deleted from Intune, a banner reading Device deleted from Intune appears under the name, with the date it was removed. Everything below it is the last state Eido captured. Only Overview, Warranty and Patches remain, because the rest needs the device to still exist in Intune.
Finding your way around#
The rail on the left lists every section. It is grouped under headings.
| Group | Sections |
|---|---|
| (no heading) | Overview, Warranty |
| Intune | Patches, Compliance, Config Policies, Managed Apps, All Apps, Device Issues, Driver Failures, Defender, Active Malware, EPM Elevations, Remediations, Scripts, Autopilot, Remote Sessions |
| Eido AI | AI Diagnostics, Script Runs |
| Eido Client | Device Metrics, Events, Inventory, Tools |
Patches, Compliance, Config Policies and Managed Apps carry a coloured dot once the device has a grade for them, so you can see where the trouble is before opening anything.
Events, Inventory and Tools open into a list of their own. Press the row to expand it, then choose an entry.
Overview#
Overview lists the properties Intune holds for the device, in groups you can expand and collapse. Device Properties is open to begin with.
| Group | Examples of what is in it |
|---|---|
| Device Properties | Device name, operating system and version, owner type |
| Hardware Properties | Manufacturer, model, serial number, chassis type, processor architecture, total and free storage, whether the device is encrypted, Wi-Fi and Ethernet MAC addresses |
| Enrollment | Enrolled date, join type, enrolment type and profile, device category, registration state |
| Advanced Properties | Device IDs, compliance state, management agent and state, last sync time, Autopilot enrolment, malware counts, Exchange and Configuration Manager details, management certificate expiry |
| Mobile Only | IMEI, MEID, UDID, ICCID, phone number, carrier, Android security patch level |
Many rows have a short explanation beside them. A property Intune does not hold for this kind of device is simply empty.
Warranty#
Warranty appears in the rail when Eido has a warranty end date for the device.
- Warranty Details gives the Purchase Date and the Expiry Date, each with how long ago or how far ahead it is.
- Warranty Breakdown lists each entitlement the manufacturer returned, with its Service Level Description, Start Date and End Date.
The Warranty chip in the header reads Active while the expiry date is in the future, Expired once it has passed, and Unknown when Eido has no date.
Dell warranty information is looked up automatically. HP and Lenovo need an administrator to connect them first. See Integrations.
Patches#
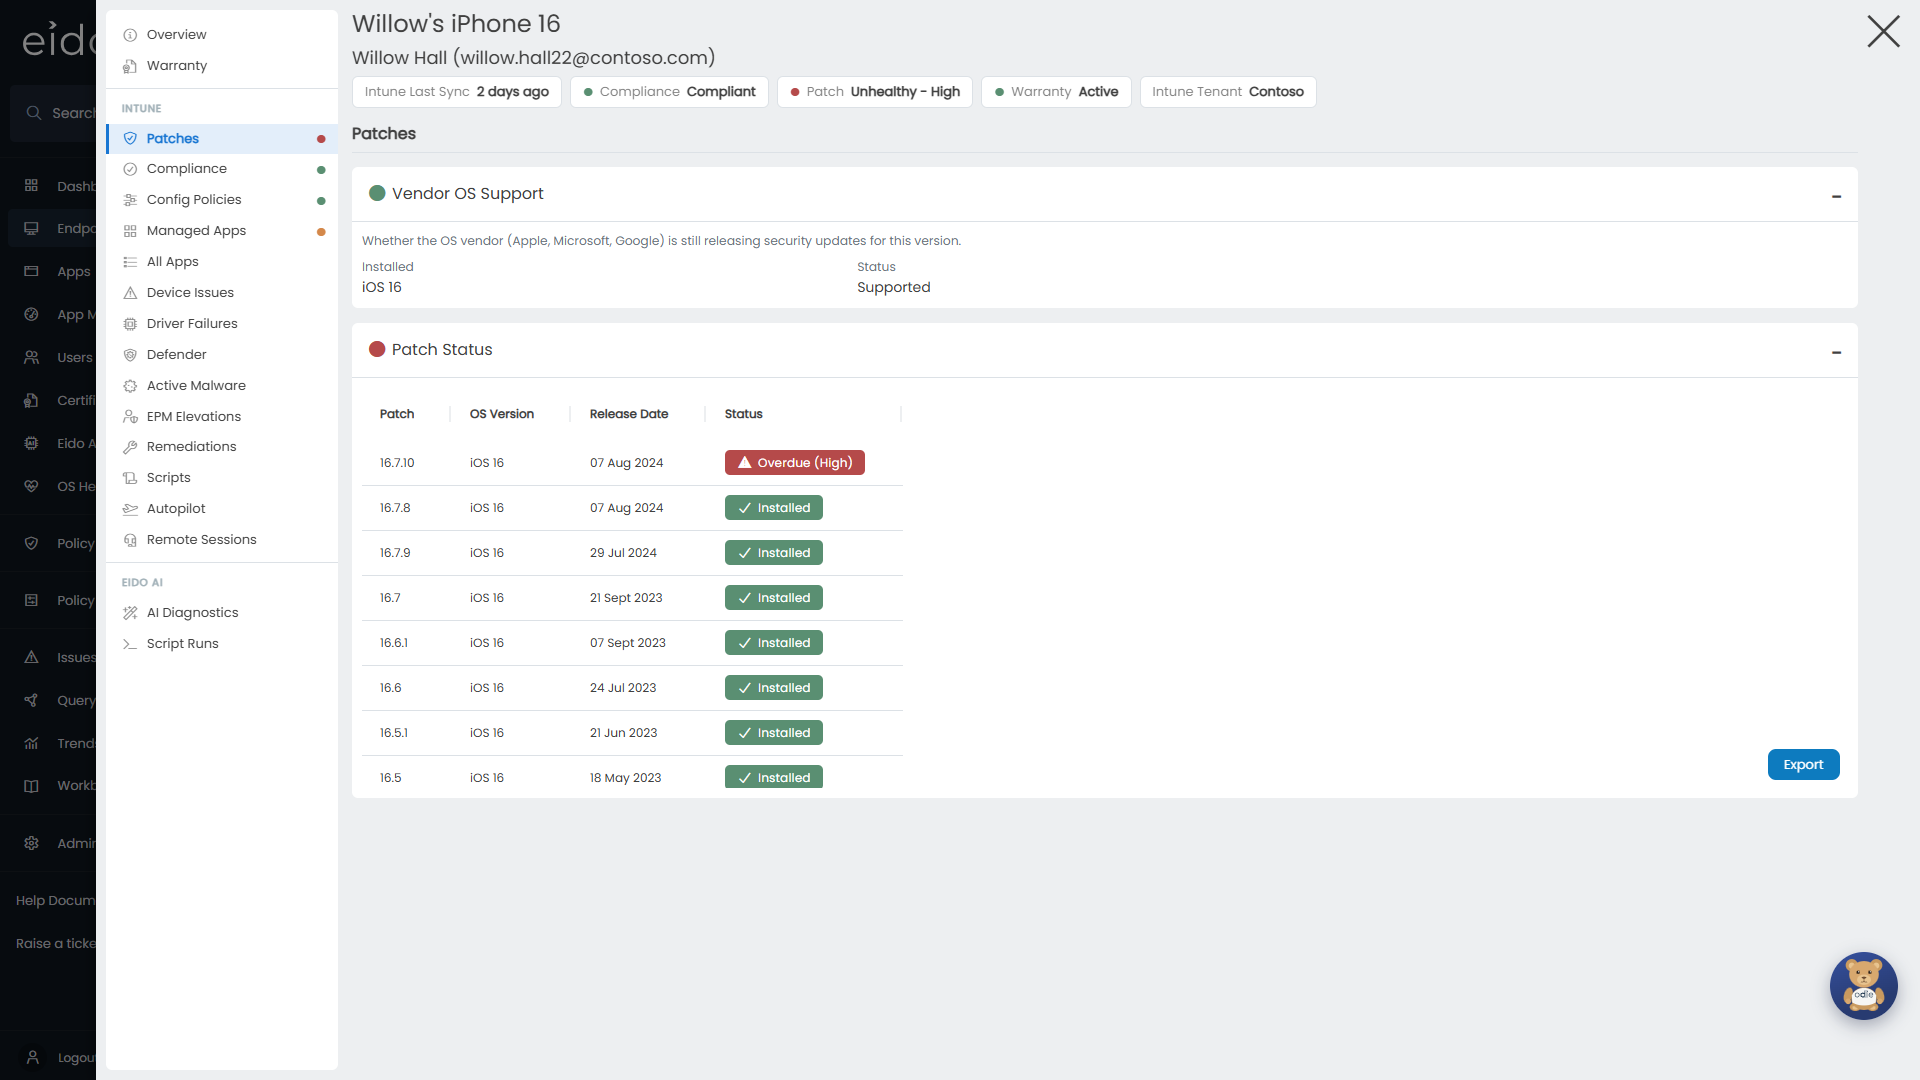
Patches explains the device’s Patch grade. It has up to three parts, each with a coloured dot of its own. The grade in the header is the worst of them.
Vendor OS Support#
Whether the vendor (Microsoft, Apple or Google) is still releasing security updates for the installed version.
| Field | Meaning |
|---|---|
| Installed | The operating system version, with its edition in brackets where there is one. |
| Status | Supported, Support Ending Soon, Not Supported or Unknown. |
| End of support | The month support ends, and how far away that is. |
Support Ending Soon (amber) starts 30 days before the end of support date. Not Supported (red) starts 7 days before it, and stays once the date has passed. Unknown means Eido does not recognise the version. Your administrator can set a different end date for a Windows version. See OS Compliance.
Major OS Compliance#
This part only appears when an administrator has switched on major OS rules for the tenant and one of them applies to this device.
| Field | Meaning |
|---|---|
| Required | What the rule asks for, for example a named version “or newer”, “Latest only”, or “Within 1 major of” the newest version the hardware supports. |
| Installed | The major version on the device. A badge such as “2 majors behind” is added when it is behind. |
| Status | The grade this check gives the device. |
Patch Status#
The table lists the security patches released for the device’s operating system.
| Column | Meaning |
|---|---|
| Patch | The patch identifier, such as a Windows KB number. |
| OS Version | The device’s operating system version. |
| Release Date | When the vendor released it. |
| Status | Whether the device has it. See below. |
| Status | Colour | Meaning |
|---|---|---|
| Installed | Green | The device is on this patch or a later one. |
| Pending | Green, with a clock | Released and not yet installed, but still inside the time your organisation allows. |
| Deferred until ~date | Green, with a clock | The device’s update ring has not offered this patch yet. The date is when Eido expects it to be offered. |
| Overdue (Medium) | Amber | Not installed, and past the medium threshold. |
| Overdue (High) | Red | Not installed, and past the high threshold. |
| OS Not Supported | Red | The operating system version has passed its end of support date, so every patch row reads this. |
| Unknown | Grey | Eido cannot tell which patch the device is on. |
Export downloads the table.
How the thresholds work, and how an administrator changes them, is in Patch Compliance.
The update ring#
If the device is in a Windows Update for Business update ring, a chip above the table reads Update Ring with the ring’s name and its deferral, for example “7d deferral”. Press it for the ring’s details.
| Field | Meaning |
|---|---|
| Quality update deferral | How many days after release the ring waits before offering a security update. |
| Install deadline | How many days the device has to install an update once it is offered. |
| Restart grace period | How many days the device has to restart after the deadline. |
| Quality updates paused | Yes, with the date the pause ends, or No. |
Eido does not count a patch as overdue until the ring has offered it: the overdue clock starts at the release date plus the deferral. A device with no chip is not in a ring that Eido knows about, and is graded from the release date.
Compliance, Config Policies and Managed Apps#
These three sections work the same way. Each lists the policies, or apps, assigned to the device, one row each with a coloured dot. The worst are at the top.
Press a row to expand it. A table shows each assignment behind it.
| Column | Meaning |
|---|---|
| Metric Name | The policy or app. |
| Intune State | The state Intune reports, coloured by the grade Eido gives it. |
| Assignment | Who the result is for: a user’s name, or Device when it applies to the device itself. A policy that applies per user can have a row for each person who uses the device. |
Managed Apps adds three columns that help with a failed install: Install Reason, Error Code and Last Attempt.
Assignments that Intune reports as not applicable to the device are left out.
See why a policy is failing#
In Compliance and Config Policies, click a row in the expanded table to open the policy’s settings for this device. This is a live question to Intune, so it takes a moment.
- The heading is the policy name, with its type and its overall state on this device.
- Each setting has a status, its name, any detail Intune gives, and where they exist its Value, an Error code, the User it applies to and its path.
- Problems only is on to begin with, so you see just the settings that are in error, in conflict or not compliant. Switch it off to see every setting. If nothing is wrong, every setting is shown.
- Refresh asks Intune again.
- Two times are shown beside the buttons. Retrieved is when Eido asked. Intune data from is when Intune last updated its own report, which can be hours behind the device.
A setting in conflict can be expanded. Policies delivering this setting lists every policy that sets it, with its type, the value it sets where Eido knows it, and its status on the device. The policy you opened is marked (Current Policy). A line under the table says where the answer came from: Reported by Intune for this device, or from the policy settings Eido has synced, which tells you what the policies say rather than what the device did.
If Eido cannot show the settings, it says why. Intune does not publish a setting by setting report for every policy type, a newly assigned policy can take a while to appear, and Intune sometimes asks Eido to slow down. In that last case, try again in a moment. If the message says Eido does not have permission to read policy reports, see Permissions Eido needs.
All Apps#
All Apps lists every application Intune has discovered on the device, whether or not it was deployed by Intune: Application Name, Publisher, Version and Short Version. Export downloads the list. To see which other devices have the same application, use Apps.
More from Intune#
The rest of the Intune group are reports from Query Hub, already filtered to this one device. Each has the same search, filters, columns and export as it does there, and an Open in QueryHub button to carry on with it at full size.
| Section | What it lists for this device |
|---|---|
| Device Issues | The issues Eido has raised. See Issues. |
| Driver Failures | Driver updates that failed to install. |
| Defender | The state of Microsoft Defender on the device. |
| Active Malware | Malware detections. See Active malware. |
| EPM Elevations | Endpoint Privilege Management elevation events. |
| Remediations | The results of remediation scripts. See Remediations and scripts. |
| Scripts | The results of platform scripts. |
| Autopilot | Windows Autopilot details for the device. |
| Remote Sessions | Remote assistance sessions with the device. |
Eido AI#
When Eido AI is switched on, two more reports appear, again filtered to this device.
- AI Diagnostics lists the diagnostic sessions run for it.
- Script Runs lists the scripts those sessions ran on it.
See AI diagnostics.
Eido Client#
The Eido Client group appears when the Eido Client is switched on. On a device that does not have the client installed, the rows are greyed out and cannot be opened.
Device Metrics#
Live performance counters, read from the device when you open the section. Nothing is stored in Eido, so each load is a fresh request to the device.
- 1h, 6h, 24h and 7d set the period.
- The first list sets how finely the period is divided. Auto picks a sensible interval for the period, from 1 minute for an hour to 1 hour for a week.
- The second list chooses whether each point is the Avg, Min or Max of its interval.
- Refresh reads the counters again. Last refreshed says when you last did.
Each counter has a chart of its own, with its latest value. When there are counters of several kinds, tabs such as All let you show one kind at a time, with a count on each. A counter with several instances, such as one line per disk, shows them together on one chart.
If the charts cannot be shown, the section says why: the device is offline, the live connection is unavailable, or the client needs to update.
Events#
Windows events the client collects, in four reports: BSODs & Shutdowns, App Crashes, App Install Failures and Intune/MDM Errors. Each is a Query Hub report filtered to this device.
Inventory#
Detailed inventory collected by the client. Each entry is a Query Hub report filtered to this device.
| Area | Collections |
|---|---|
| Hardware | Batteries, Memory Modules, Physical Disks, Volumes, Printers, System Info |
| Operating system | OS Health, Windows Features, Windows 11 Readiness, Services, Startup Items, Runtimes, WSL Distros, WSL Status |
| Security | Certificates, Defender Status, Firewall Profiles, Secure Boot, Security Posture, MDM Health |
| Software | Installed Apps, Browser Extensions, Browser Status, Office Status, OneDrive Status |
| Network | Network Adapters, Network Profiles, Proxy Settings, Wi-Fi Profiles, Wi-Fi Status |
| People | Local Profiles, Local Users |
In the rail they are in one alphabetical list.
Last refreshed at the top shows when the client last checked its inventory. The refresh button beside it asks for a check now. If the device is offline, the request waits for its next check in, and Eido tells you so.
Tools#
Tools work on the device live, while you watch. Every result is a snapshot from the moment you asked, so use the refresh button in a tool to take a new one.
| Tool | What it does |
|---|---|
| Intune Doctor | Runs a set of checks on the device’s Intune management and lists recent MDM errors. Trigger Intune sync starts a sync, and View IME log shows the end of the Intune Management Extension log. |
| Event Viewer | Browses the Windows event logs by channel, filtered by level, a page at a time. Click an event to read its full message. |
| Process Explorer | Lists running processes with their user, memory and start time. |
| Services | Lists Windows services with their state and start type. |
| File Explorer | Browses drives and folders, and measures the size of a folder. |
| Registry Explorer | Browses registry keys and values under a chosen hive. |
| Network Tools | Runs Ping, Traceroute or DNS lookup from the device, or lists its Connections. |
| Print Queue | Lists printers, and the jobs waiting on the one you select. |
| Logged In Users | Lists the people signed in to the device and their sessions. |
An administrator chooses which tools are available for a tenant. A tool that is switched off is greyed out in the rail.
Some tools can also change the device: End process; Start, Stop, Restart and Apply start type for a service; creating, editing and deleting registry keys and values; Clear queue and Cancel job for a printer; Disconnect and Sign out for a signed in user. These buttons only appear when an administrator has allowed them for the tenant, and only for administrators. Eido asks you to confirm each one, and may open a small Microsoft sign in window to check that it is really you. Each change is recorded.
Switching tools and their actions on and off is covered in The Eido Client.
The Real-Time chip#
Device Metrics and Tools use a live connection of their own, separate from the rest of the Eido Client. Inventory, patch data, app metering and client updates carry on working when that connection is down. That is why a device can read Eido Client: Online and still have no live tools.
| Chip reads | Colour | Meaning |
|---|---|---|
| Connected | Green | Metrics and tools will work. |
| Reconnecting | Amber | The device can reach the service but is not connected at this moment. |
| Pending | Amber | The connection is still being set up. |
| Blocked | Red | Something on the network is stopping the connection. |
| TLS Inspected | Red | A proxy or firewall is inspecting the connection, which breaks it. |
| Proxy Blocked | Red | A proxy is refusing the connection. |
| DNS Blocked | Red | The device cannot look up the address it needs. |
| Unavailable | Grey | The live connection is not available. |
| Not Reported | Grey | The device has not told Eido yet. This is normal for a client that has not updated recently, and is not a fault. |
Press the chip to open Real-Time Channel. It gives a one line verdict, how the device is connected, when it was last checked, and the result of each check as Pass, Warn, Fail or Not run. Hover over a check for the detail. The checks are in two groups: Checked by Eido and Checked on the device. Below them, What the customer’s network must allow lists the destinations and ports to give to whoever runs the firewall.
Re-run checks asks the device to test again. The device does so at its next check in, so reopen the panel a few minutes later to see the result.
Common questions#
Why is the Eido Client group greyed out?#
The Eido Client is switched on for your organisation, but this device does not have it installed yet. See The Eido Client.
Why is there no Eido Client group at all?#
The Eido Client is not switched on, or the device has been deleted from Intune.
Why is there no Warranty section?#
Eido has no warranty end date for the device. Warranty lookups cover Dell, HP and Lenovo, and HP and Lenovo have to be connected first.
Why does Eido Client say Online when Real-Time says Blocked?#
They are two different connections. The client is reporting in, so inventory and patch data are current, but the live connection used by Device Metrics and Tools cannot get through. Press the Real-Time chip to see which check failed. See The Real-Time chip.
Why does a patch say Pending when the device is weeks behind?#
Pending means the device is still inside the time your organisation allows, or inside the number of patches it is allowed to be behind. The rules are in Patch Compliance.
Why does every patch say OS Not Supported?#
The operating system version has passed its end of support date, so the vendor will not release more patches for it. The fix is to upgrade the operating system, not to install a patch.
Why does the policy settings panel say there is no report?#
Intune has not produced a report for that policy on this device yet, or does not produce one for that type of policy. For a newly assigned policy, try again later.