
App Metering shows how much the applications you care about are really used: how many people and devices ran each one, for how long, on which version, and when they last opened it. It is the page to open before a licence renewal, when the question is “we pay for 200 seats of this, how many do we need?”.
Everybody who can sign in to Eido can open it from the sidebar, and sees the usage of the Intune tenants and customers their role gives them access to.
What is measured#
App Metering does not watch everything a device runs. An administrator chooses a list of applications, and Windows devices report only when one of those applications starts and stops. From that, Eido works out:
- who ran it (the account the application ran as, matched to a person in Entra ID)
- on which device
- which version of the application
- for how long, per day
A few rules explain the numbers you will see.
| Rule | What it means for you |
|---|---|
| Usage is running time | Time counts while the application is open, whether or not somebody is typing into it. An application left open over lunch is still running. |
| Overlaps are counted once | Two windows of the same application open at the same time on the same device count as one stretch of time, not two. |
| A missing close is capped | If Eido never hears that an application closed (the device lost power, say), that session is counted up to the device’s last report, and never for more than four hours. |
| An application left open | On a device that reports through the Eido Client, an application that is simply left open is counted for as long as the client keeps seeing it running, day after day. On a device that reports through the remediation scripts it is counted for up to four hours from when it was opened. The rest is added when it is closed, provided that is within about a week. |
| Days are calendar days in UTC | A day’s usage is totalled once the day has ended, so today’s usage appears tomorrow. |
| Nothing else is recorded | Not window titles, not documents, not web addresses, and nothing about applications that are not on the list. |
Only Windows devices are metered.
The application list#
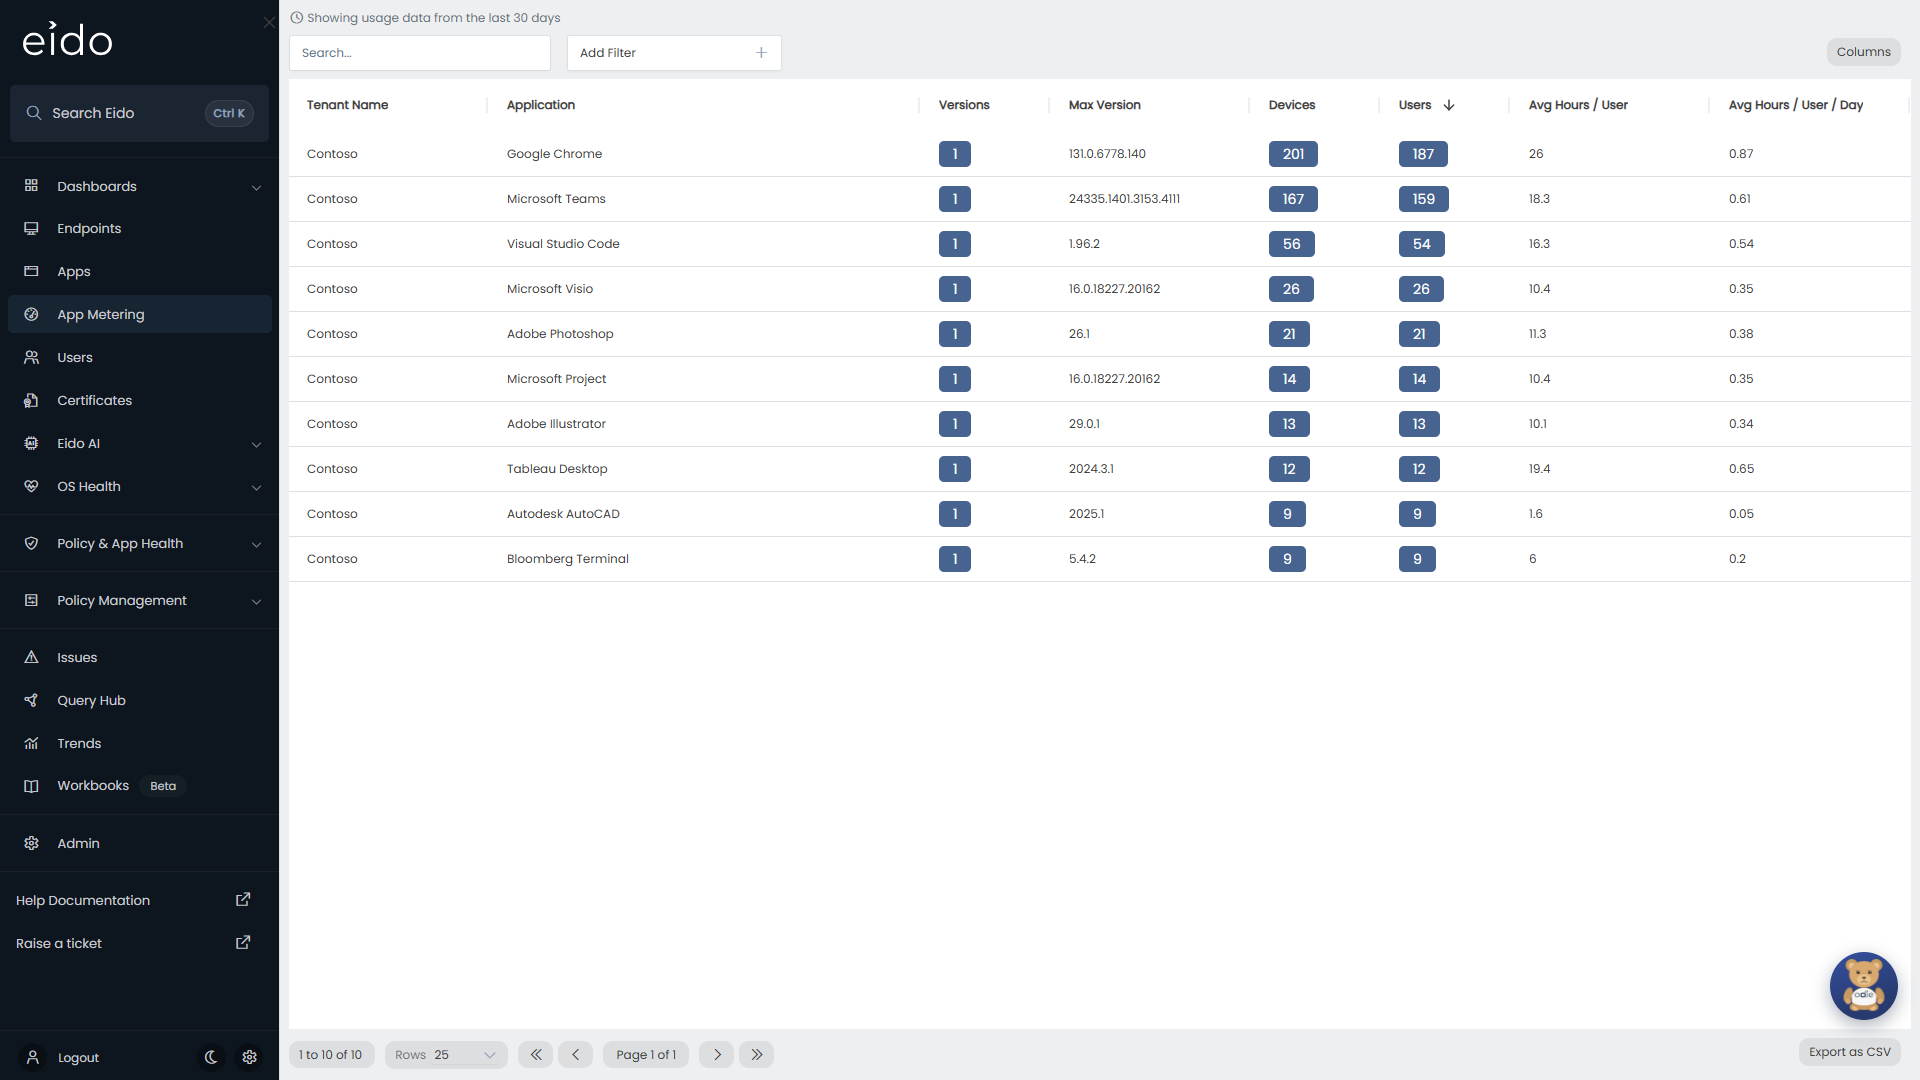
The line above the table reads Showing usage data from the last 30 days. Every figure on this page covers those 30 days. To look at a different period, open an application (see Look at one application).
| Column | What it shows |
|---|---|
| Customer | The customer the tenant belongs to. Only shown when your organisation manages several customers and no single customer is selected. |
| Tenant Name | The friendly name of the Intune tenant the usage was measured in. |
| Application | The application, under the name your administrator gave it when adding it to the list. |
| Versions | How many different versions were seen in use. A high number often means an upgrade that has not finished rolling out. |
| Max Version | The highest version seen in use. |
| Devices | The number of devices the application was used on. |
| Users | The number of people who used it. This is the figure to compare with the licences you own. |
| Avg Hours / User | The average total hours each user spent in the application over the 30 days. |
| Avg Hours / User / Day | The same average spread across the 30 days. |
The list opens sorted by Users, most first, 25 applications to a page.
An application that is on the list but that nobody has opened in 30 days is still shown, with zeros. An application an administrator has disabled is not shown at all.
Search, filter and export#
- Search… finds applications by name.
- Add Filter narrows the list by Application, Customer, Intune Tenant, Users or Devices. The two number filters start as “at least this many”.
- Columns chooses which columns are shown.
- Export as CSV, below the table, downloads the list as you have filtered it.
Look at one application#
Press a row to open the application’s detail panel.
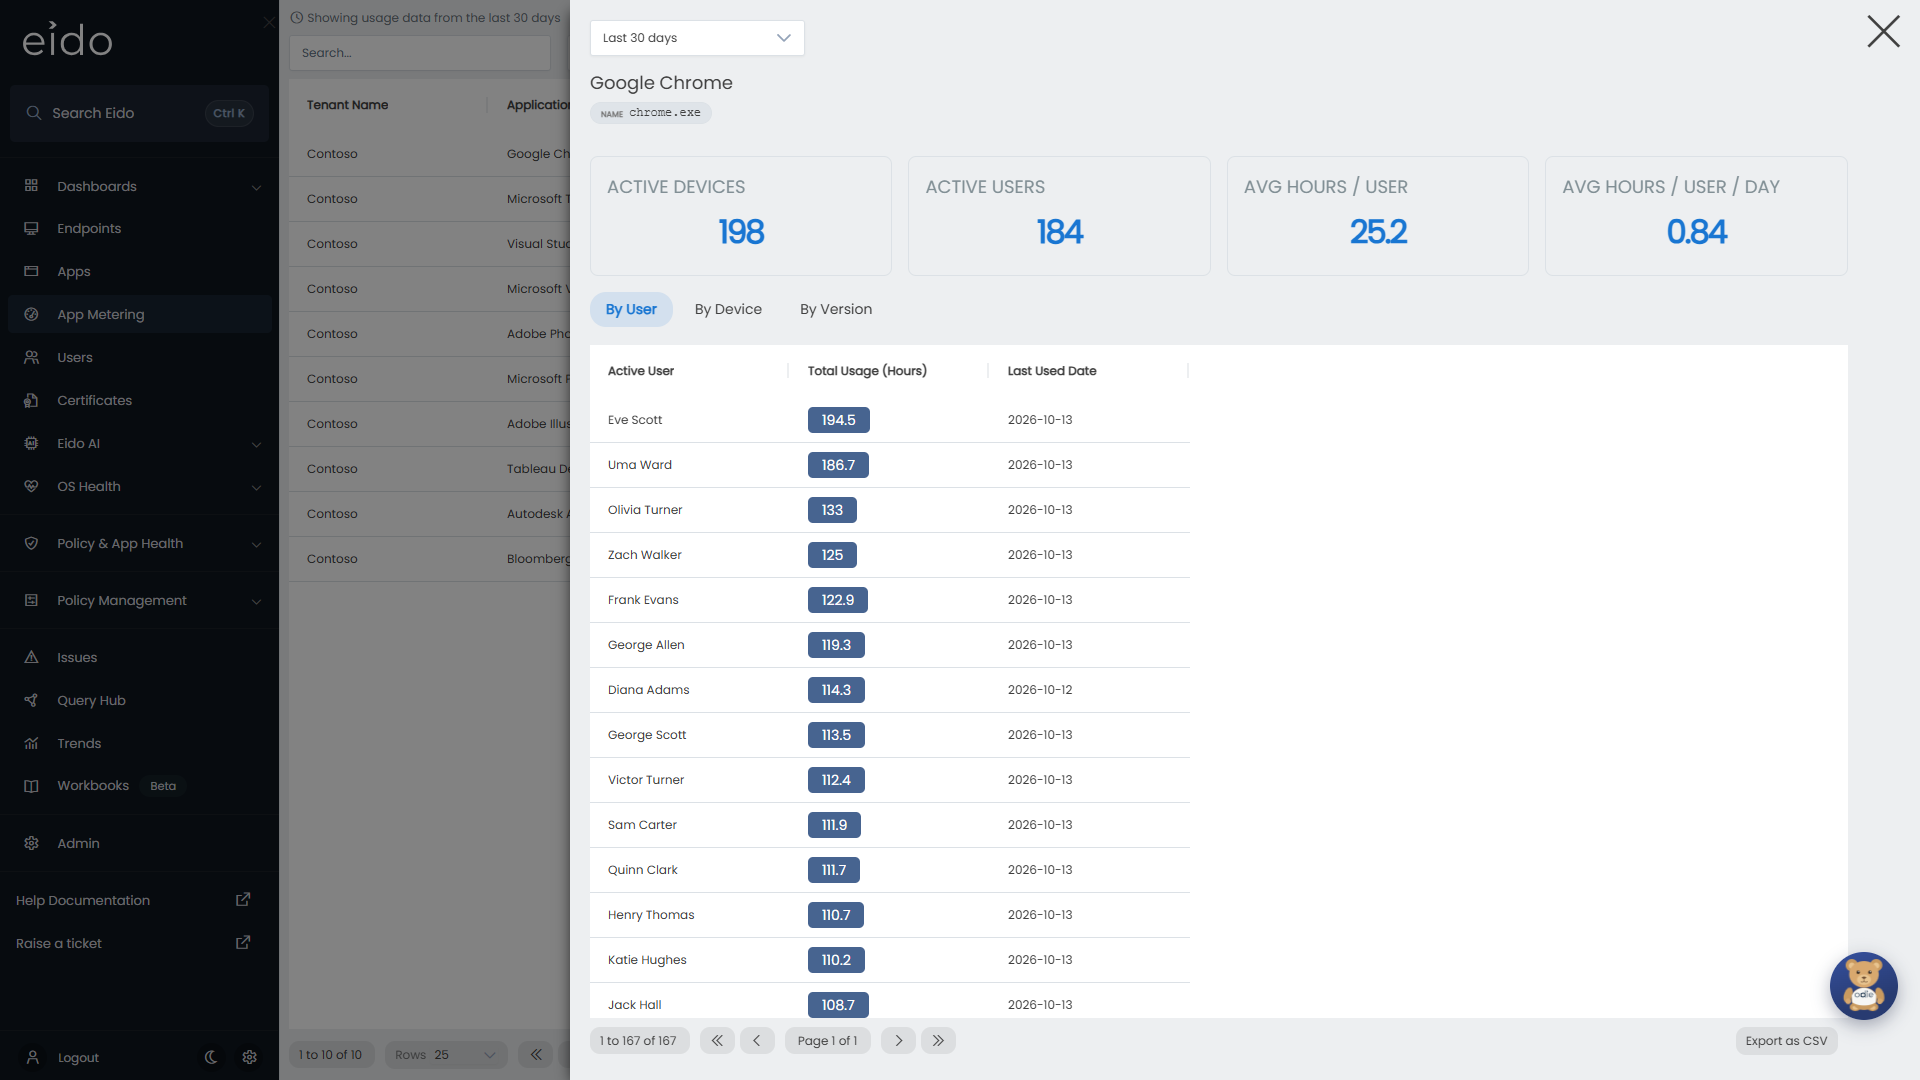
At the top is the date range, then the application’s name and the rules that identify it (for example name and Acrobat.exe). Those rules are set by an administrator, and they are shown here so you can see exactly which programs are being counted under this name.
Choose the period#
| Option | Covers |
|---|---|
| Last 7 days | The last week. |
| Last 30 days | The default. |
| Last 90 days | The last quarter. |
| Custom range | Any start and end date you pick. The end date cannot be in the future. |
Changing the period reloads the tiles and all three tabs.
The tiles#
| Tile | What it shows |
|---|---|
| Active Devices | The number of devices the application was used on in the period. |
| Active Users | The number of named people who used it in the period. |
| Avg Hours / User | The average total hours per user across the period. |
| Avg Hours / User / Day | That average divided by the number of days in the period. |
The tabs#
| Tab | One row for each | Columns |
|---|---|---|
| By User | Person who used the application | Total Usage (Hours), Last Used Date |
| By Device | Device it was used on | Total Usage (Hours), Last Used Date |
| By Version | Version that was run | Total Usage (Hours), Last Used Date, Devices, Users |
Each tab lists everything, heaviest usage first, so the lightest users and devices are at the bottom of the list.
Last Used Date is the most recent day in the period on which the application ran for that person, device or version.
Names that are not people#
Each person on By User is shown with their sign-in name after their name, so two people with the same name are two rows. Most rows are people from Entra ID. Usage that Eido cannot tie to a person is grouped under one of these names instead.
| Name | What ran the application |
|---|---|
| System, Local Service, Network Service | Windows itself, for example a background updater or a service. |
| Service Account | A Windows service running under its own account. |
| Local User | A local Windows account on the device that is not an Entra ID user. |
| Unknown | An account Eido could not identify. |
An administrator can leave system accounts and local accounts out of an application’s figures altogether. See Setting up App Metering.
Find licences you can reclaim#
-
Start with the list
Sort is already by Users. Compare Users for each application with the number of licences you pay for. A large gap is the first sign of waste.
-
Open the application and widen the period
Choose Last 90 days. Somebody who has not opened an application in a quarter is unlikely to miss it.
-
Read By User from the bottom
The people at the foot of the list used the application least. A person with a fraction of an hour and an old Last Used Date opened it once and never came back.
-
Look for who is missing
People who never opened the application in the period are not in the list at all. Compare By User with your own record of who holds a licence. Everybody on your record who is not on the tab is a candidate.
-
Check where it is installed
Discovered Apps shows the devices an application is installed on. Installed on many devices but used on few is the pattern to look for.
Questions people ask#
Why is App Metering not in my sidebar?#
It is switched on per Intune tenant. Either no tenant has it on, or none of the tenants you can see has it on. An administrator switches it on under Admin → Intune Tenants.
Why does an application show zero users?#
Either nobody has opened it in the last 30 days, or its devices are not reporting yet. If every application shows zero, it is the second. See Check that devices are reporting.
Why is yesterday the latest day I can see?#
Usage is totalled per calendar day, in UTC, once the day has ended. Today’s usage appears tomorrow.
Why is Users on the list one higher than Active Users in the detail?#
The list counts all usage that could not be tied to a named person (System, Local User, Unknown and so on) as one extra user. The Active Users tile counts named people only. The two also differ whenever you choose a period other than 30 days.
Why are the average hours so high?#
Usually because a background part of the application runs all day under a system account, for example an updater. Ask an administrator to switch on Exclude System Accounts for that application. The figures for roughly the last six days are recalculated; older days keep the figures they had.
Why does the same usage appear under two applications?#
If two entries on the list have rules that match the same program, both count it. Adding up hours across applications then counts that usage twice. Each application’s own figures are still right.
Why has usage from an old device gone?#
The By User and By Device lists, and what is sent to ServiceNow, cover devices that are in Intune now. When a device is retired, replaced or enrolled again as a new device, the usage recorded on the old one is no longer listed. Somebody who changed laptop part way through a period shows the use on the new laptop only.
Why did a person’s hours change after the day ended?#
When a device reports late (it was offline, or an application was still open at midnight), Eido recalculates the last few days as the missing reports arrive. Usage that arrives later than that, for example from a laptop that was switched off for a fortnight, is added to the days it belongs to on the night it arrives. Older figures can go up this way, but they do not go down.