
Released: 7 March 2026
Eido Release 26.3: Introducing QueryHub
Overview#
Release 26.3 introduces QueryHub, a powerful new capability designed for enterprise environments that need greater flexibility and control over Microsoft Intune reporting.
QueryHub allows organizations to query, shape and visualize their Intune data exactly the way they need. Rather than relying solely on predefined reports, you can now build tailored reports, dashboards and insights based on the specific requirements of your environment.
With QueryHub, teams gain complete control over how their Intune data is explored and presented.
QueryHub#
QueryHub enables you to design and run custom queries across your Intune data, giving you the flexibility to generate the insights that matter most to your organization.
Key capabilities include:
- Build powerful custom queries across Intune data
- Shape and structure results without being restricted to static reports
- Surface targeted insights tailored to operational or business needs
This release introduces a new level of flexibility for enterprise Intune reporting.
See Query Hub.
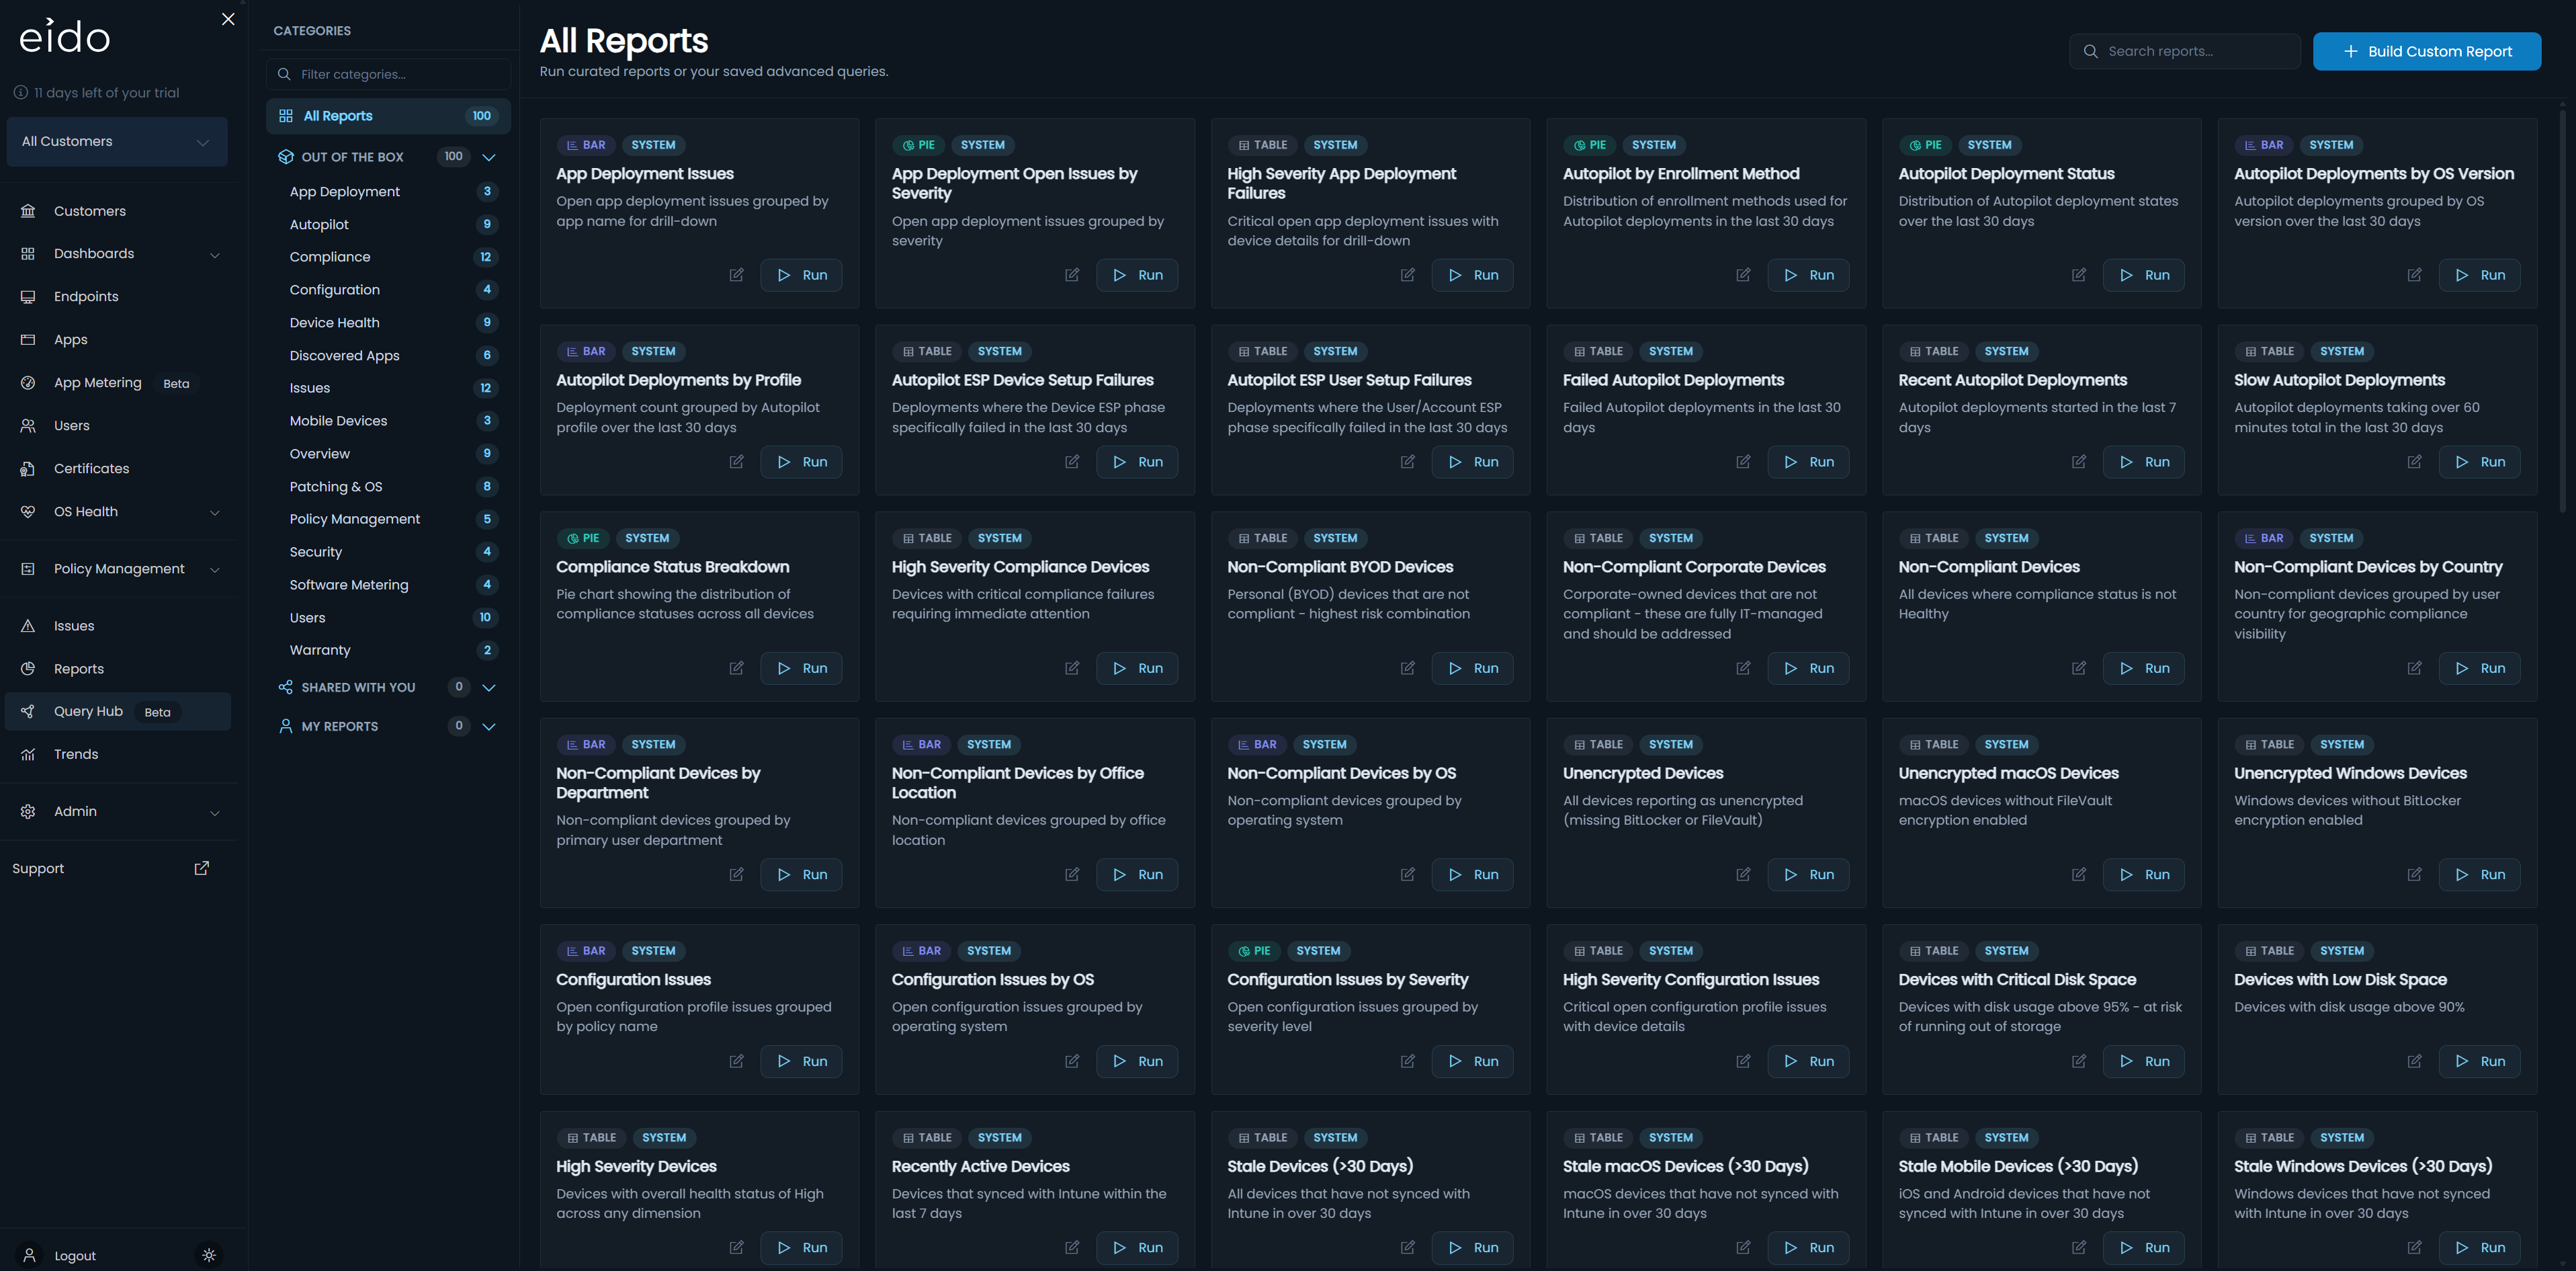
Out-of-the-box reports#
Eido continues to provide immediate value with 100+ ready-built reports covering key areas of your Intune environment, including:
- Autopilot performance
- Compliance posture
- Patching and update gaps
- Device health
- Configuration drift
- Security exposure
- Software usage
- Licensing risk
These reports provide quick visibility while Query Hub enables deeper customization when required.
Custom reports#
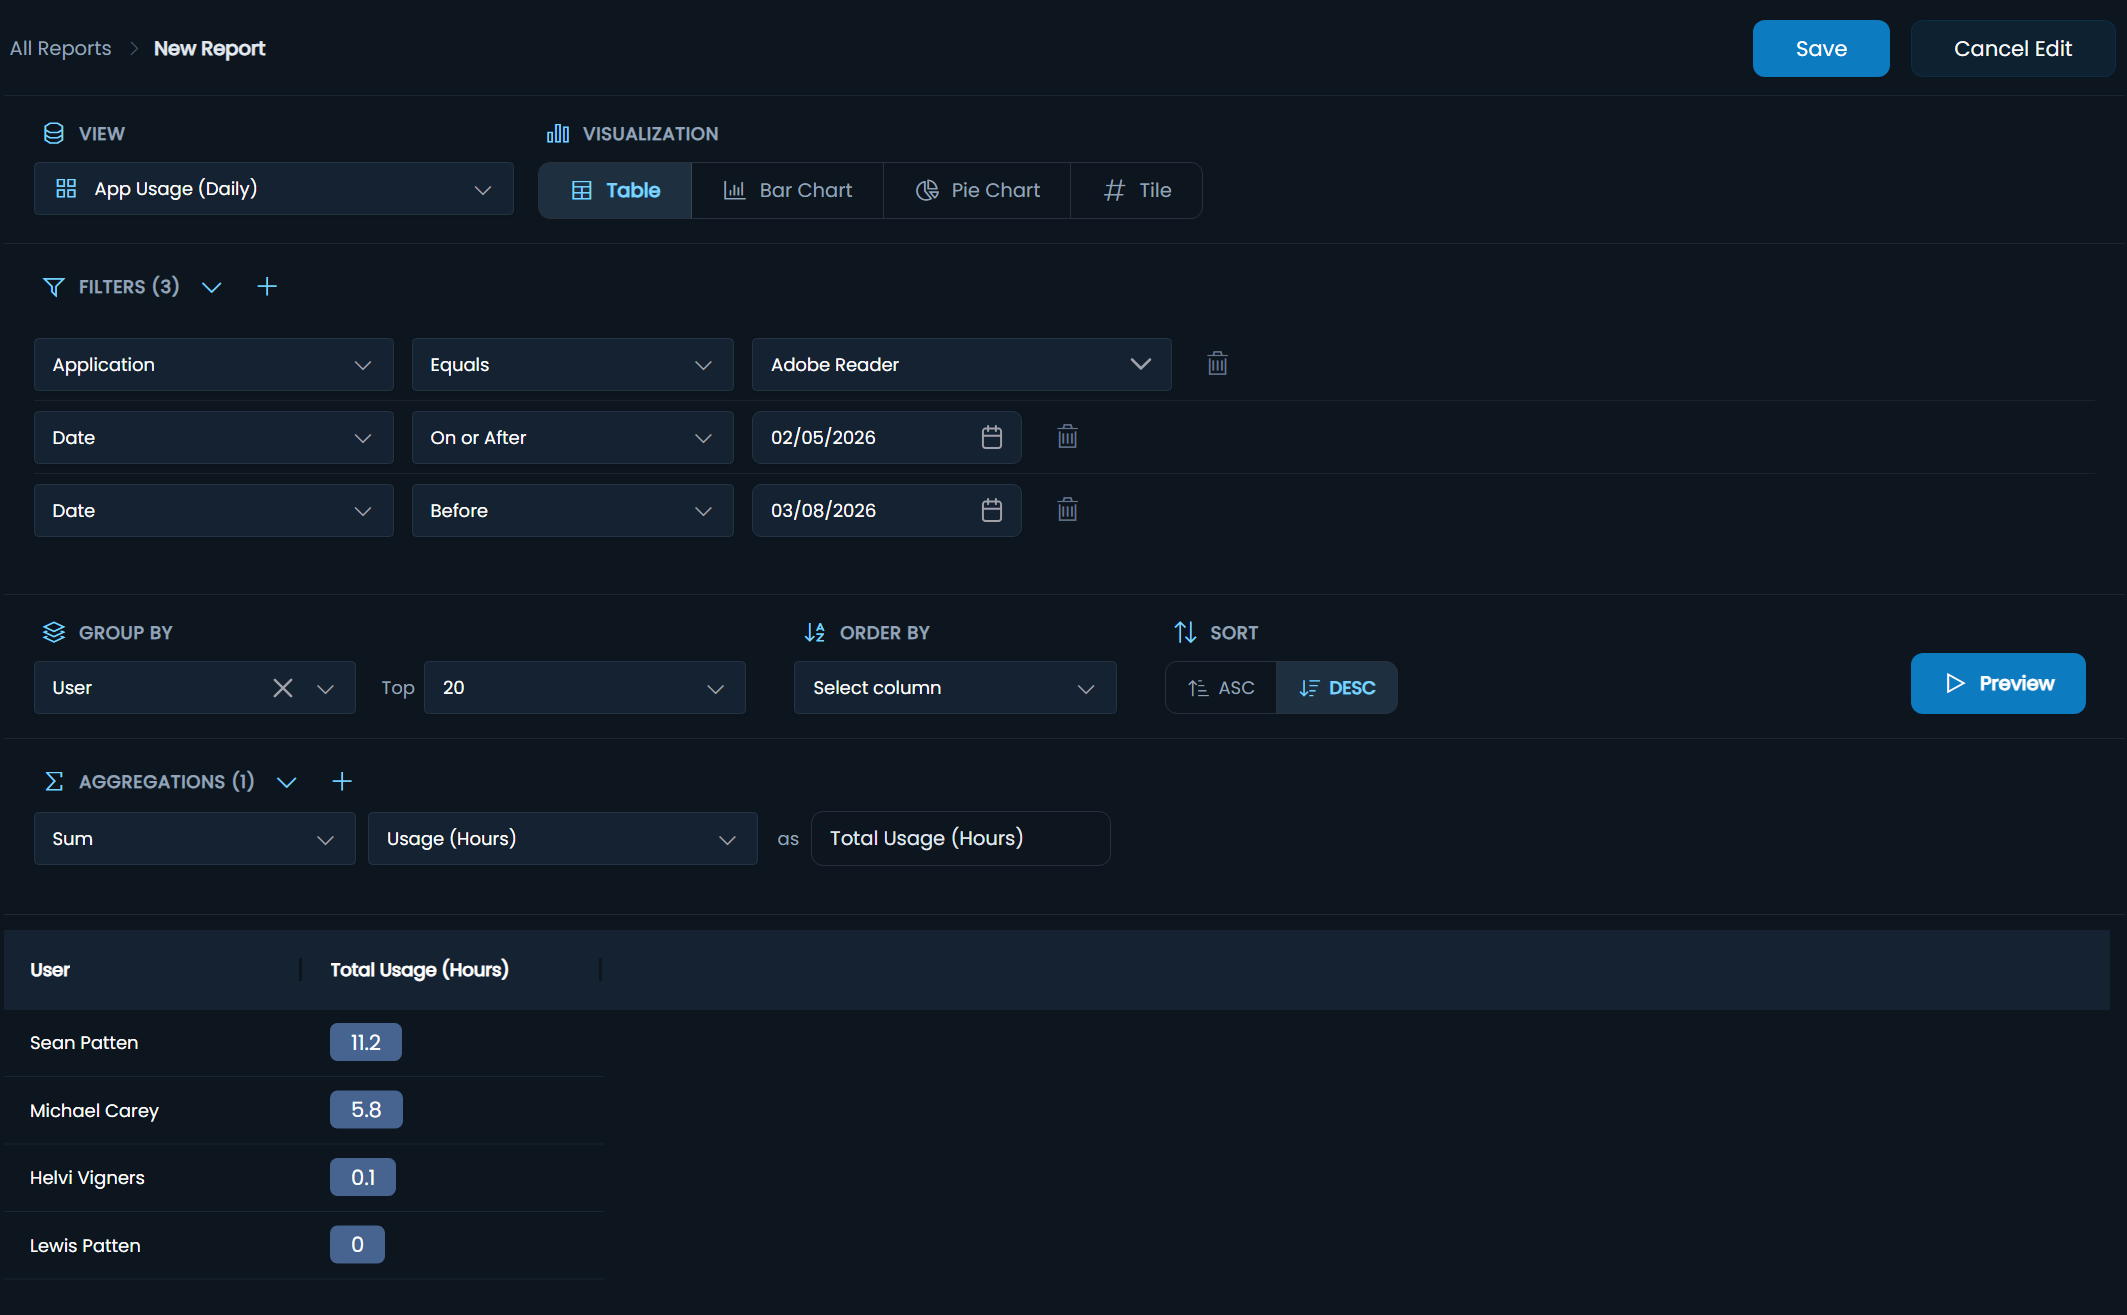
Query Hub allows you to build fully customized reports tailored to your organization.
Visualization options#
You can display results using:
- Table
- Bar Chart
- Pie Chart
- Tile
Data grouping#
Group data to highlight trends, patterns or breakdowns across your estate.
Aggregations#
Apply multiple aggregations within a single report, including:
- Count
- Sum
- Max
- Min
- Average
- Distinct
Advanced filtering#
Use flexible filtering capabilities, including:
String filtering
- Contains
- Starts with
- Ends with
Date and time filtering
- Before
- After
- In the last
- More than ago (for example: more than 7 days ago or in the last 30 days)
Report scheduling#
Reports can be scheduled to run automatically:
- Daily
- Weekly
- Monthly
Sharing#
Reports can be shared with colleagues across your organization.
See Building a query and Saving and exporting reports.
Custom dashboard widgets#
QueryHub can also power custom dashboard widgets, allowing you to build dashboards tailored to specific teams, users or operational requirements.
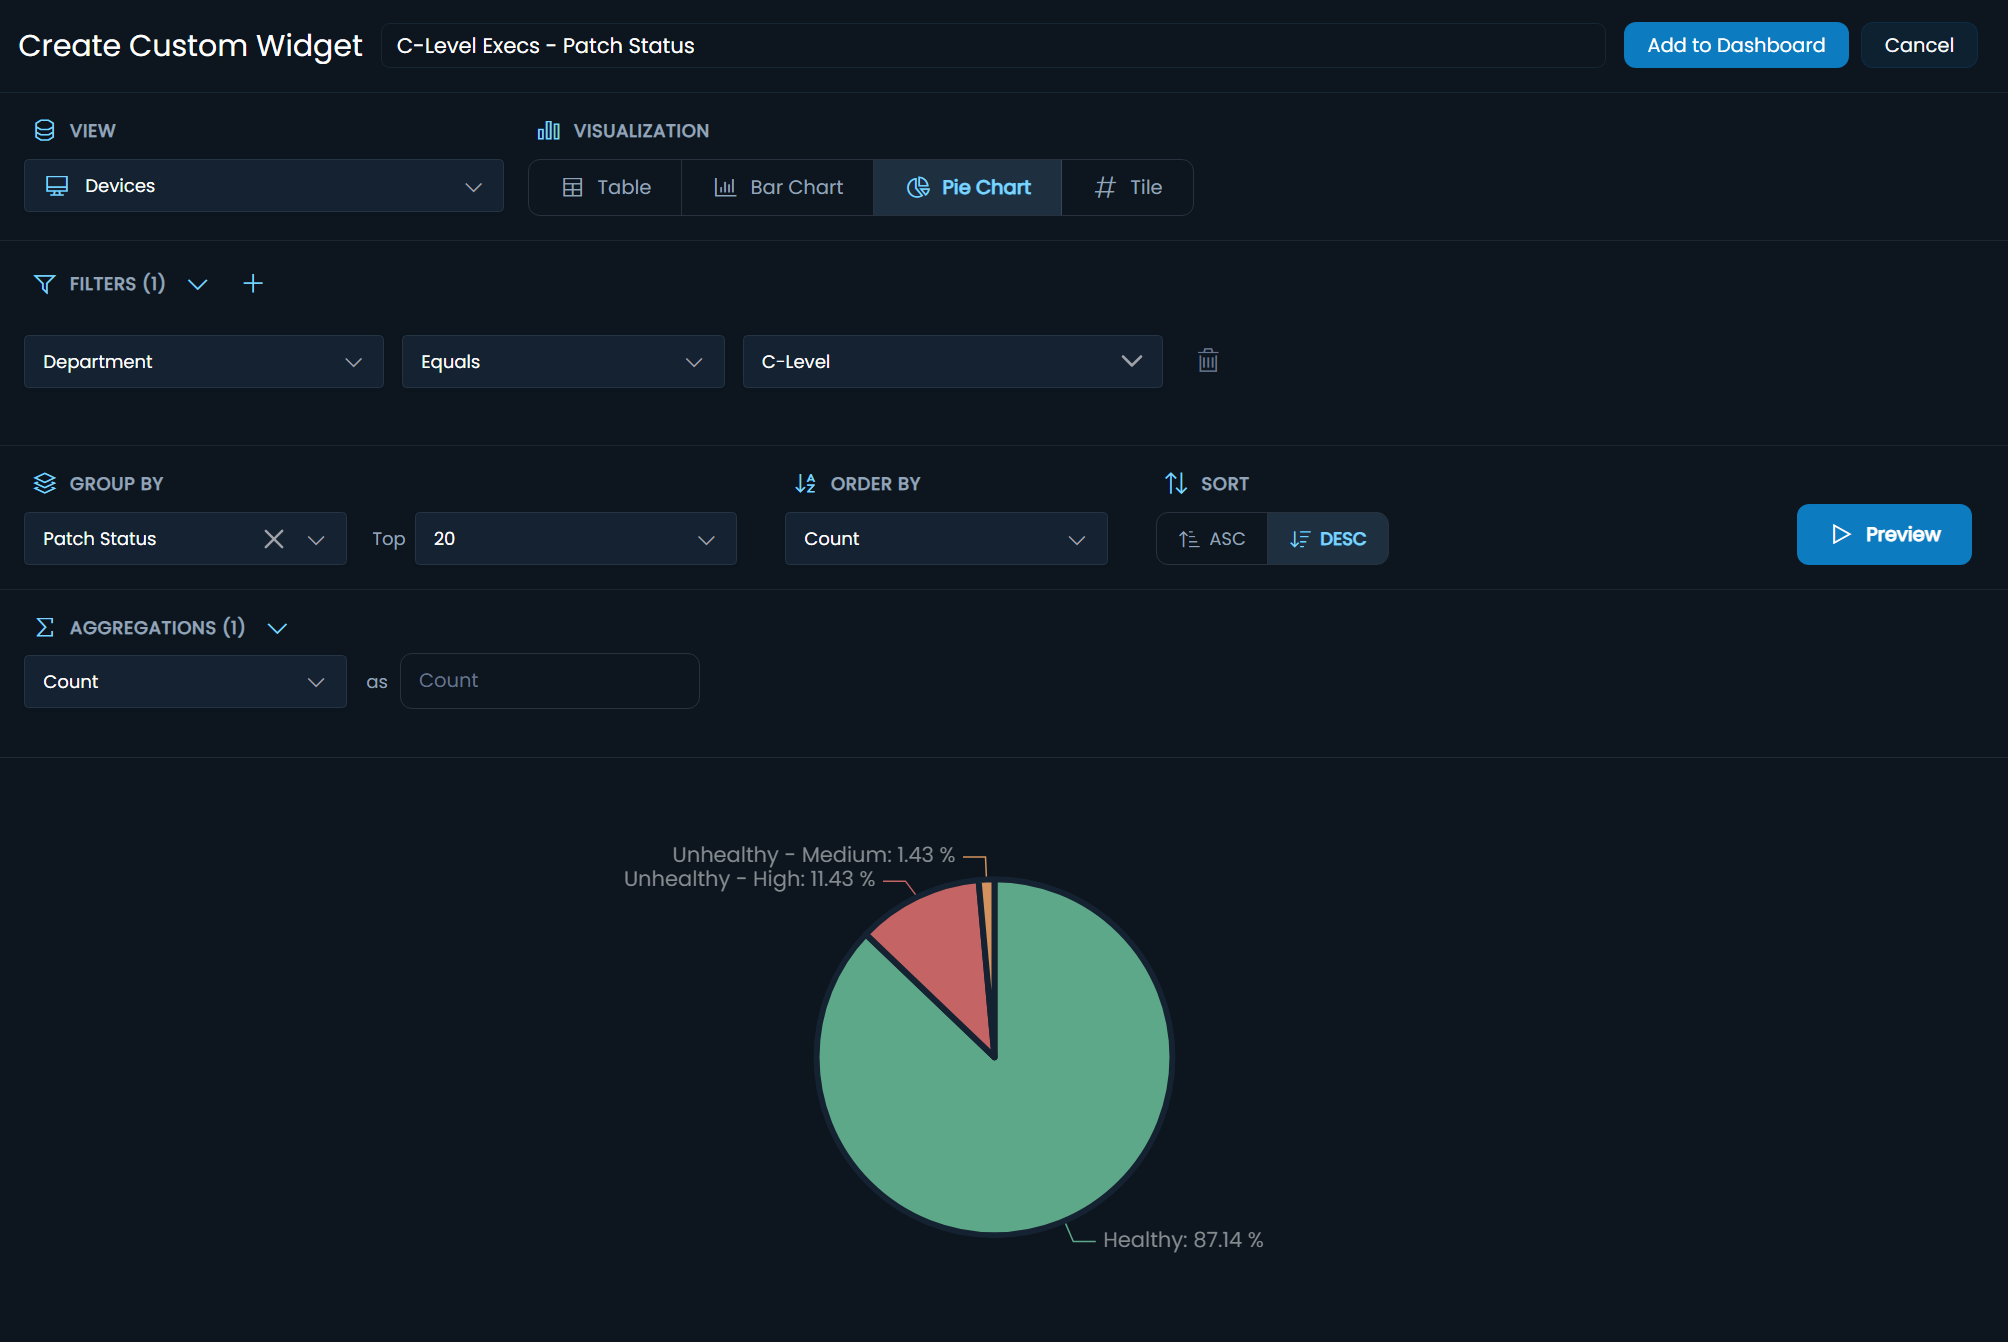
Example use cases include:
- Dashboards focused on VIP users or executives
- Tracking patch compliance by business unit
- Monitoring devices not patched for more than 7 days
- Identifying Autopilot deployments exceeding 60 minutes
- Highlighting high-risk or vulnerable endpoints
Supported widget visualizations#
- Tile
- Pie Chart
- Bar Chart
- Table
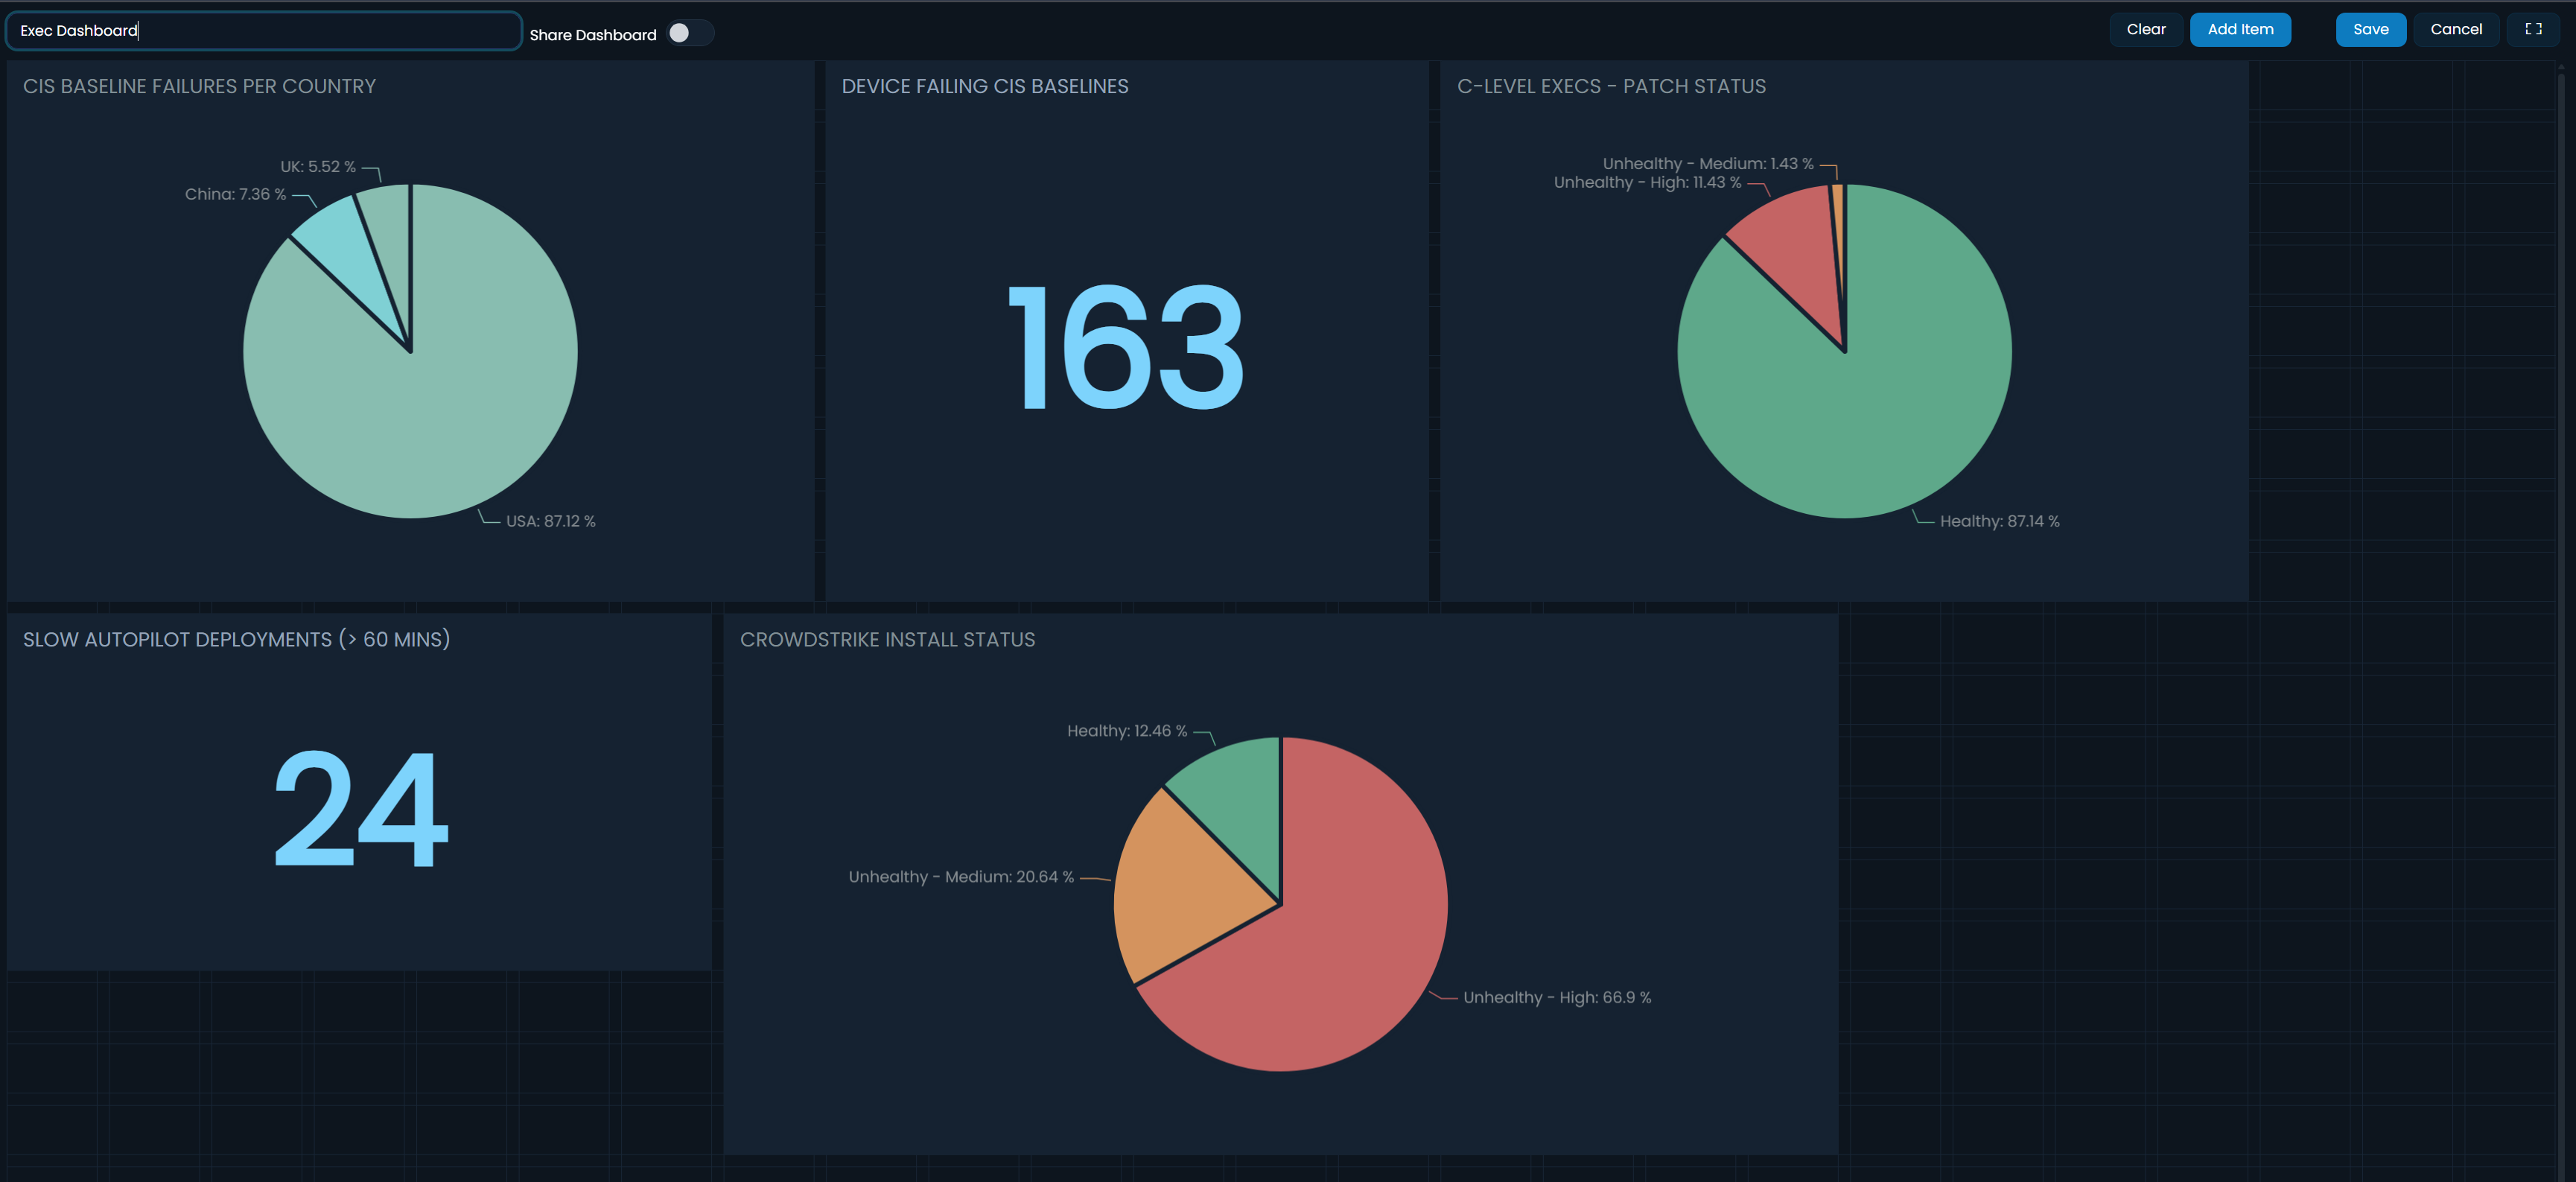
See Building a dashboard.
Other enhancements#
Entra extended attributes#
Entra device and user extended attributes are now synchronized, allowing them to be used for:
- Filtering
- Grouping
- Reporting
Dashboard sharing#
Dashboards can now be shared with other members of your team, improving collaboration and visibility.
Learn more#
If you would like to see QueryHub in action, you can request a personalized demo.
Request a demo: https://www.eido.io
Alternatively, contact the Eido team to arrange a walkthrough.